
Figure 2.
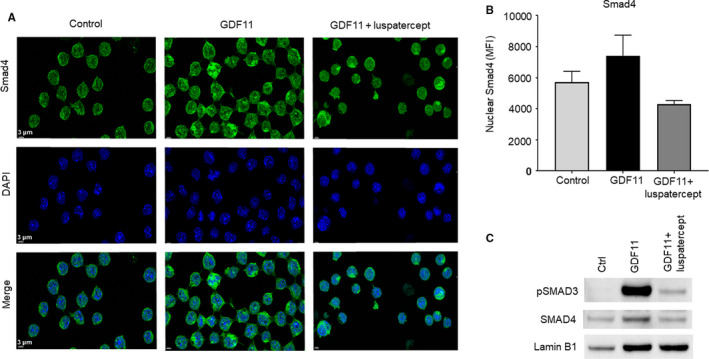
Smad2/3‐pathway overactivation increases, and luspatercept co‐treatment reduces, nuclear localization of Smad4 in MEL cells. A, Immunofluorescence microscopy showing effect of GDF11 (100 ng/mL, 24 h) alone or in combination with luspatercept (1 µg/mL) on cellular distribution of Smad4 in DMSO‐pretreated MEL cells (control). Images depict Smad4 (green/AF488) with DAPI‐labelled nuclei (blue). Scale bar, 3 µm. B, Smad4 levels determined by mean fluorescence intensity. Data are means ± SEM, (n = 3 images per group). P‐value .0521. C, Western blot analysis showing effect of GDF11 (100 ng/mL) alone or in combination with luspatercept (1 μg/mL) on nuclear levels of pSmad3 and Smad4 in MEL cells pretreated with 2% DMSO (control) to induce differentiation. LaminB1 served as nuclear protein loading control