Figure 4.

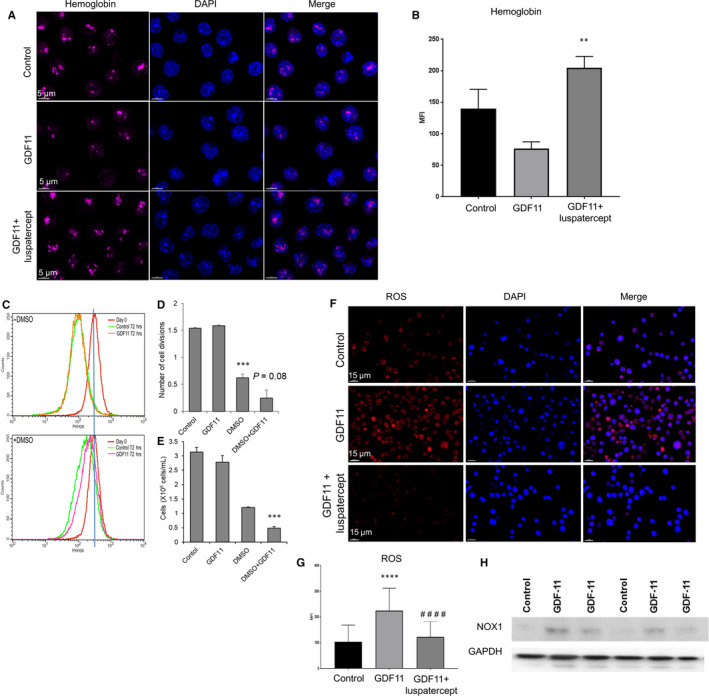
Smad2/3‐pathway overactivation reduces MEL cellular proliferation and haemoglobin levels, increases ROS and prevents nuclear condensation typical of erythroid differentiation. A, Immunofluorescence microscopic images of MEL cells showing haemoglobin‐α (magenta/AF647) as a way of measuring haemoglobin, DAPI, and a merge of the two signals. Scale bar, 5 µm. B, Haemoglobin‐α levels determined by mean fluorescence intensity. Data are means ± SEM (n = 3 images per group), GDF11‐luspatercept vs. control **P < .05. C, Cell‐division histograms (based on PKH26 staining) at baseline and 72 h as a function of treatment with GDF11 (100 ng/mL) or DMSO + GDF11. D, Number of cell divisions at 72 h. Data are means ± SEM, ***P < .001 vs. control. E, Cell density at 72 h. Data are means ± SEM, ***P < .001 vs. DMSO. F, Reactive oxygen species staining visualized via immunofluorescence in MEL cells pretreated with DMSO treated additionally with GDF11 (100 ng/mL) or combined GDF11 (100 ng/mL) and luspatercept (1 µg/mL) for 24 h. Scale bar, 50 µm. G, Bar graph representing relative fluorescence intensity for ROS levels from panel D. Cells with positive fluorescence were considered for quantitative analysis. ****P < .0001 control treatment vs GDF11, #### P < .0001 GDF11 vs GDF11 + luspatercept treatment. H, NOX1 protein expression by Western blot analysis of DMSO‐pretreated MEL cells (control) treated additionally with GDF11 (100 ng/mL) or combined GDF11 (100 ng/mL) and luspatercept (1 µg/mL) for 24 h
