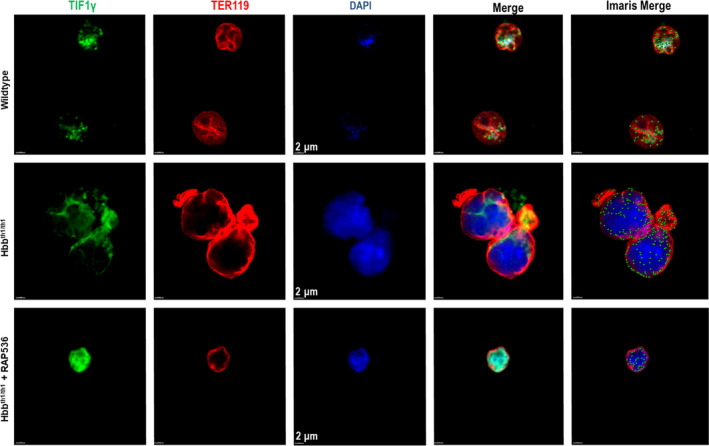
Figure 9.

RAP‐536 treatment in vivo restores nuclear localization of TIF1γ in TER119 + bone marrow cells of Hbbth1/th1 β‐thalassaemic mice to a focal pattern typical of wild‐type mice. Immunofluorescence microscopy showing the levels and subcellular distribution of TIF1γ in TER119+ bone marrow cells from wild‐type mice and Hbbth1/th1 β‐thalassaemic mice (HOM) treated with a single dose of RAP‐536 (30 mg/kg, i.p, 16 hours) or vehicle. Images depict TIF1γ (green/AF488), TER119 (red), DAPI‐labelled nuclei (blue) and the merge of these three independent images. Scale bar, 2 µm. This merged image was further processed with Imaris software to better visualize the levels and subcellular distribution of TIF1γ by conversion of diffuse labelling to punctate labelling. As visible in the Imaris merged images, green punctate labelling representing TIF1γ is mainly distributed focally within the nuclei of erythroblasts from wild‐type mice and β‐thalassaemic mice treated with RAP‐536. By contrast, TIF1γ labelling in the noticeably larger erythroblasts from vehicle‐treated β‐thalassaemic mice is localized primarily circumferentially in the perinuclear region
