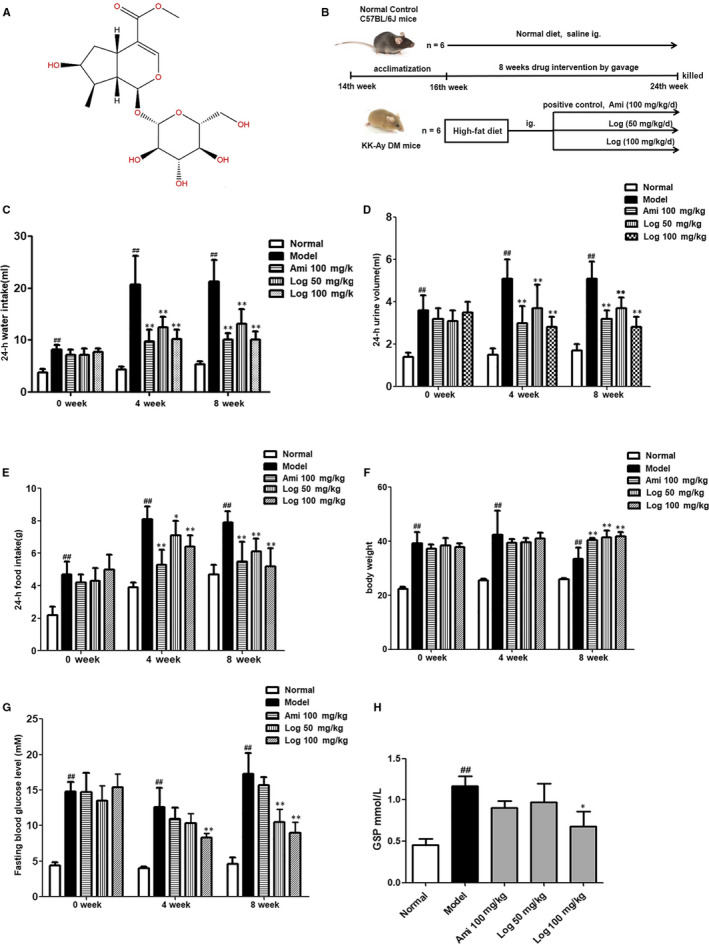
FIGURE 1.

Loganin ameliorated general diabetic symptoms in DM mice. A, Structure of loganin. B, Flow chart of animal study design. C, 24‐h water intake in the fourth and eighth weeks of experiment. D, 24‐h urine volumes in the fourth and eighth weeks. E, 24‐h food consumptions in the fourth and eighth weeks. F, Bodyweights in the fourth and eighth weeks. G, Fasting blood glucose levels in the fourth and eighth weeks. H, Serum GSP level at the end of experiment. Significance: ## P < .01 vs normal group; *P < .05, **P < .01 vs model group
