
FIGURE 2.
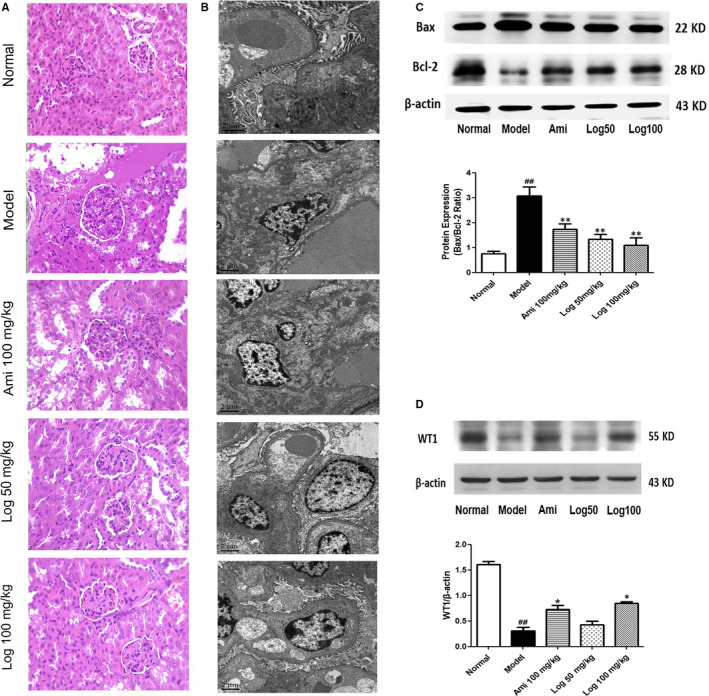
Loganin showed renal protective effects in KK‐Ay mice. A, HE staining of kidney tissues. B, Transmission electron microscopy of glomeruli. C, Western blot analyses of Bax and Bcl‐2 protein expression in kidney cortex. The Bax/Bcl‐2 ratio was calculated and analysed. D, Western blot analyses of WT1 protein expression in kidney cortex. Bars represent the mean ± SD, n = 3. Significance: ## P < .01 vs the normal group, *P < .05, **P < .01 vs the model group