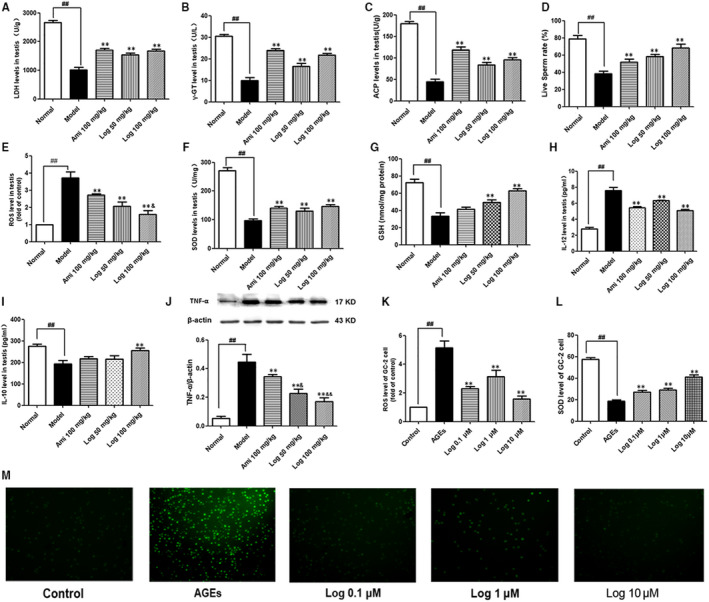
FIGURE 6.

Loganin improved oxidative stress, inflammatory response and down‐regulated testis‐specific enzymes. A, LDH level in testis homogenate. B, γ‐GT level in testis homogenate. C, ACP level in testis homogenate. D, Live sperm rate. E, ROS level in testis homogenate. F, SOD level in testis homogenate. G, GSH level in testis homogenate. H, IL‐12 level in testis homogenate. I, IL‐10 level in testis homogenate. J, TNF‐α protein expression in the testis. (K and M) ROS fluorescence intensity in GC‐2 cells and statistical chart. L, SOD level in GC‐2 cells. Bars represent mean ± SD, n = 3. Significance: ## P < .01 vs normal or control group; **P < .01 vs model or AGE group; & P < .05, && P < .01 vs aminoguanidine group
