FIGURE A7.

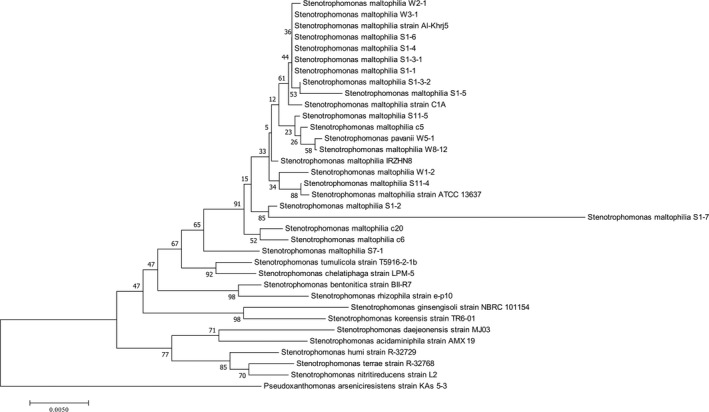
Phylogenetic tree constructed using 16S rRNA gene sequences showing the relatedness between Stenotrophomonas isolates from this and previous studies. The scale bar at the bottom represents the number of nucleotide substitutions per site

Phylogenetic tree constructed using 16S rRNA gene sequences showing the relatedness between Stenotrophomonas isolates from this and previous studies. The scale bar at the bottom represents the number of nucleotide substitutions per site