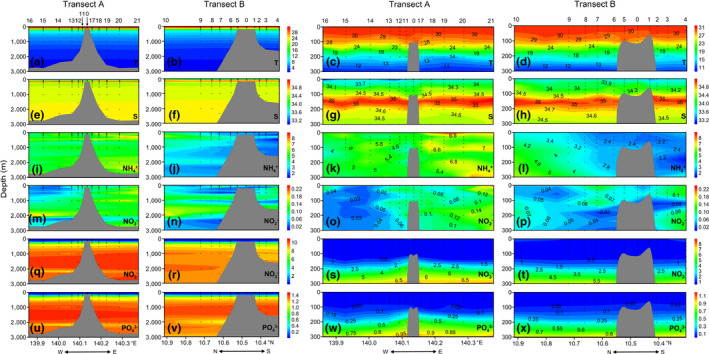
Figure 2.

Vertical distributions of environmental factors along Transects A and B in 0–3,000 m (1st and 2nd columns) and 0–300 m (3rd and 4th columns) water columns in the Caroline Seamount. T (a‐d): temperature, °C; S (e‐h): salinity; NH4 + (i‐l), NO2 – (m‐p), NO3 – (q‐t), PO4 3– (u‐x): μmol/L. E, east; N, north; S, south; W, west. Figures created in Golden Software Surfer v. 13, https://www.goldensoftware.com/products/surfer
