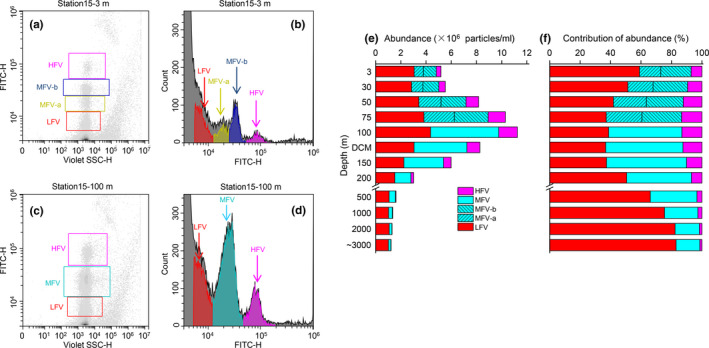
Figure A1.

Viral subcluster cytograms (a–d), vertical abundance profile for various subclusters (e), and their contributions to total viral abundance (f). (a, b) Sample cytograms of four viral subclusters in upper 75 m layers; (c, d) sample cytograms of three viral subclusters in 100 m and deeper layers. HFV, high fluorescence viruses; LFV, low fluorescence viruses; MFV, medium fluorescence viruses, MFV classified as subclusters MFV‐a and MFV‐b in upper 75 m layers. Indicated abundances are averages for all stations. Figures a‐d created in Beckman Coulter CytExpert, v. 2.3.0.84 https://www.beckman.com/flow‐cytometry/instruments/cytoflex/software. Figures e and f created in OriginLab Origin v. 8.5 https://www.originlab.com/
