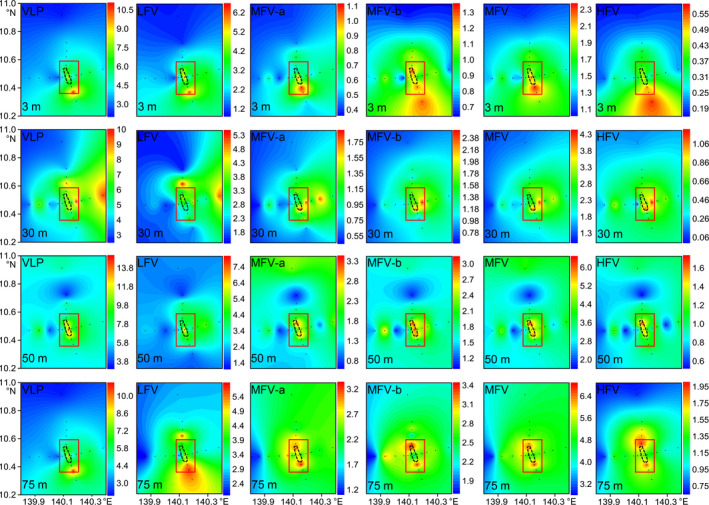
Figure A3.

Horizontal virioplankton abundance distributions in the upper 75 m water column. Dotted black lines indicate the location of Caroline Seamount summit. Seamount stations are inside the red rectangle. Others are far‐field stations. HFV, high fluorescence viruses, ×106 particles/ml; LFV, low fluorescence viruses, ×106 particles/ml; MFV, medium fluorescence viruses, ×106 particles/ml, MFV classified as subclusters MFV‐a and MFV‐b in upper 75 m layers; VLP, virus‐like particles, ×106 particles/ml. Figures created in Golden Software Surfer v. 13 https://www.goldensoftware.com/products/surfer
