Fig. 1.
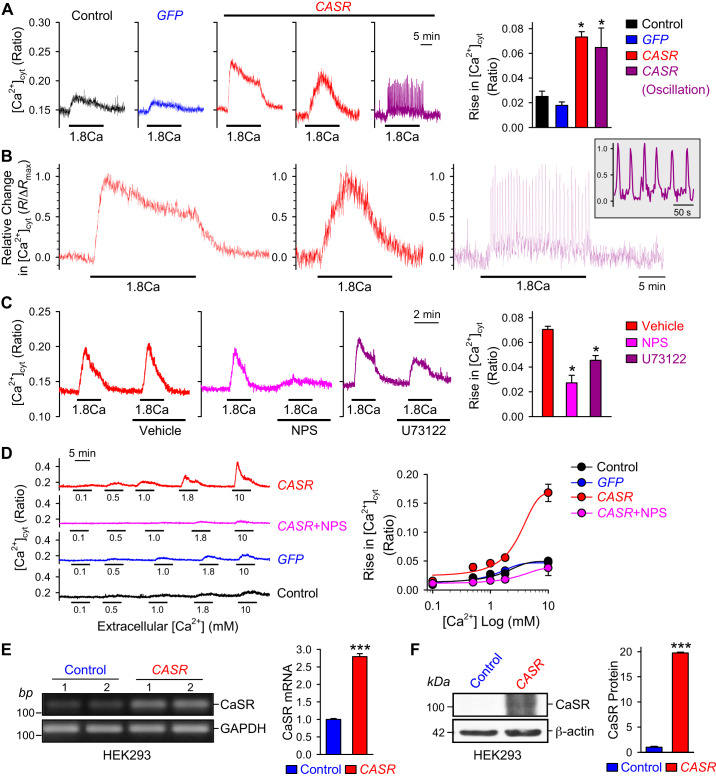
Calcium-sensing receptor (CaSR) overexpression enhances extracellular Ca2+-induced increase in cytosolic Ca2+ concentration ([Ca2+]cyt) in human embryonic kidney 293 (HEK293) cells. A: representative traces showing changes in [Ca2+]cyt in nontransfected (Control) and green fluorescent protein-transfected (GFP) and 3 different patterns in CASR-transfected (CASR) HEK293 cells before, during, and after extracellular application of 1.8 mM Ca2+. Summarized data (right, means ± SE) showing the amplitude of 1.8 mM Ca2+-induced increases in [Ca2+]cyt in control HEK293 cells and HEK293 cells transfected with GFP or CASR constructs, respectively; n = 5 cells for each group, *P < 0.05 vs. Control and GFP (ANOVA). B: normalized record of 1.8 mM Ca2+ (1.8Ca)-mediated sustained (left), transient (middle), and oscillatory (right) increases in [Ca2+]cyt in CASR-transfected cells. Inset: expanded record shown at right. C: representative traces showing changes in [Ca2+]cyt in CASR-transfected HEK293 cells before, during, and after extracellular sequential application of 1.8 mM Ca2+ and 1.8 mM Ca2+ plus vehicle (DMSO), NPS-2143 (CaSR inhibitor), or U73122 (PLC inhibitor). Summarized data (right, means ± SE) showing the amplitude of 1.8 mM Ca2+-induced increase in [Ca2+]cyt in the presence of vehicle, NPS-2143, or U73122 in HEK293 cells transfected with CASR construct; n = 6 cells for each group, *P < 0.05 vs. Vehicle (ANOVA). D: representative traces (left) showing changes in [Ca2+]cyt in nontransfected (control) and GFP-transfected (GFP) HEK293 cells as well as CASR-transfected (CaSR) cells with or without NPS-2143 (60 μM) before, during, and after extracellular application of 0.1, 0.5, 1.0, 1.8, and 10 mM of Ca2+. Summarized data (right, means ± SE) showing the dose-response curves of extracellular Ca2+-induced increases in [Ca2+]cyt in control and GFP-transfected HEK293 cells as well as in cells transfected with CASR constructs in the presence of NPS-2143; n = 5 cells for each group. E: representative RT-PCR images (left) showing the mRNA level of CaSR in control cells and cells transfected with CASR construct. Summarized data (right, means ± SE) showing mRNA level of CaSR in control cells and cells transfected with CASR construct; n = 5 cells for each group. F: representative Western blot images showing CaSR in control and CASR-transfected cells; summarized data (right, means ± SE) showing the protein levels of CaSR in control cells and cells transfected with CASR construct; n = 5 cells for each group. ***P < 0.001 vs. control (Student’s t test).

