Fig. 6.
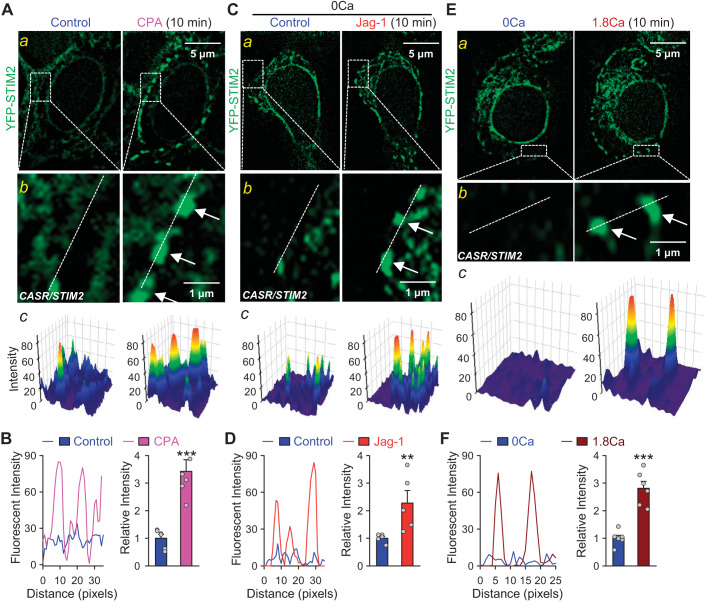
Notch activation or calcium-sensing receptor (CaSR) activation induces clustering of stromal interaction molecule 2 (STIM2) in CASR/STIM2-cotransfected human embryonic kidney 293 (HEK293) cells. A: representative fluorescent images (a) showing STIM2 clusters (green) in HEK293 cells transfected with CASR/YFP-STIM2 construct before (control) and during the treatment with cyclopiazonic acid (CPA). Magnified images (b) showing STIM2 clusters (arrows) in the puncta area and 3-dimensional images (c) showing STIM2 clusters in the puncta area as indicated in the magnified images. B: line scan graph (left) showing distribution and fluorescent intensity of STIM2 along the white dashed lines of the region indicated in b. Summarized data (means ± SE; right) showing the changes in fluorescent density of yellow fluorescent protein (YFP)-STIM2 before (control) and during application of CPA in CASR/STIM2-cotransfected HEK293 cells; n = 5 independent sets of transfected cells. C: representative fluorescent images (a) showing STIM2 (green) in cells transfected with CASR/YFP-STIM2 before (control) and during the treatment with 50 μM Jag-1 for 10 min in Ca2+-free solution. Magnified images (b) showing STIM2 clusters (arrows) in the puncta area and 3-dimentional images (c) showing STIM2 clusters in the puncta area as indicated in the magnified images. D: line scan graph (left) showing distribution and fluorescent intensity of STIM2 along the white dashed lines of the region indicated in b. Summarized data (means ± SE; right) showing the changes in fluorescent density of YFP-STIM2 before and during application of Jag-1 in Ca2+-free solution in CASR/STIM2-cotransfected HEK293 cells; n = 6 independent sets of transfected cells. E: representative fluorescent images (a) showing STIM2 clusters (green) in HEK293 cells transfected with CASR/YFP-STIM2 before (0 Ca) and after 1.8 mM extracellular Ca2+ treatment (Ca) for 10 min. Magnified images (b) showing STIM2 clusters (arrows) in the puncta area and 3-dimentional images (c) showing STIM2 clusters in the puncta area as indicated in the magnified images. F: line scan graph (left) showing distribution and fluorescent intensity of STIM2 along the white dashed lines of the region indicated in b. Summarized data (means ± SE; right) showing the changes in fluorescent density of YFP-STIM2 before and after 1.8 mM extracellular Ca2+ treatment for 10 min in CASR/STIM2-co-transfected HEK293 cells; n = 5 independent sets of transfected cells. We specifically selected regions of interest (ROIs) mostly close to the plasma membrane (i.e., the peripheral region of the cell) for analyzing the size, number, and intensity of STIM2 clusters. The summarized data (B, D, and F) show the overall intensity of the STIM2 clusters located in the peripheral regions of the cells. **P < 0.01 and ***P < 0.001 vs. control (Student’s t test).

