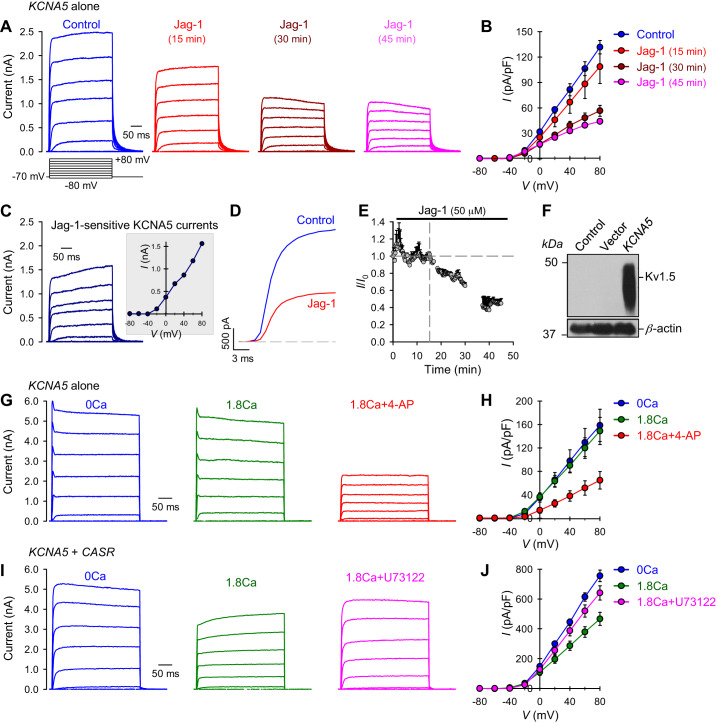
Fig. 7.
Notch activation or calcium-sensing receptor (CaSR) activation attenuates Kv1.5 channel activity in potassium voltage-gated channel 5 (KCNA5)-transfected and KCNA5/CASR-cotransfected human embryonic kidney 293 (HEK293) cells. A: representative records showing superimposed whole cell Kv1.5/KCNA5 currents, elicited by depolarizing the cells from a holding potential of −70 mV to a series of test potentials ranging from −80 to + 80 mV (in 20 mV increments) in KCNA5-transfected HEK293 cells before (control) and after 15, 30, and 45 min of extracellular application of 50 μM Jagged1 (Jag-1). B: summarized data (means ± SE) showing the current-voltage (I-V) relationship curves constructed from current recordings in HEK293 cells transfected with KCNA5 constructs before (control), and after 15, 30, and 45 min of extracellular application of 50 μM Jag-1; n = 3. P < 0.01 between control curve and Jag-1 (15 min) curve; P < 0.001 between control curve and Jag-1 (30 min) and Jag-1 (45 min) curves. C: representative record (left) and the I-V curve (inset) of Jag-1-sensitive KCNA5 currents, which were obtained by subtracting the currents recorded in Jag-1 (45 min) cells from the currents recorded in control cells. D: representative currents, elicited by depolarizing the cell from a holding potential to +80 mV in control (blue) and Jag-1-treated cells. E: data showing the mean time courses of changes in normalized whole cell KCNA5 currents measured at +80 mV in HEK293 cells transfected with KCNA5 construct before and during extracellular application of 50 μM Jag-1. F: Western blot analysis on KCNA5/Kv1.5 in control cells and cells transfected with an empty vector (Vector) or the KCNA5 gene (KCNA5). G: representative current records showing changes in whole cell K+ currents in KCNA5-transfected HEK293 cells before (0 Ca) and during extracellular application of 1.8 mM Ca2+ without (1.8 Ca) or with (1.8 Ca + 4-AP) the addition of a non-specific KV channel antagonist 4-aminopyridine (4-AP; 1 mM). H: summarized data (means ± SE) showing the current-voltage (I-V) relationship curves constructed from current recordings in HEK293 cells transfected with KCNA5 constructs before (0 Ca) and during extracellular application of 1.8 mM Ca2+ without (1.8Ca) or with (1.8Ca + 4-AP) the addition of 4-AP; n = 5 cells for each group. P < 0.01 between the 1.8Ca + 4-AP curve and the curves of 0 Ca and 1.8 Ca (ANOVA). I: representative current records showing changes in whole cell K+ currents in KCNA5/CaSR-cotransfected HEK293 cells before (0 Ca) and during extracellular application of 1.8 mM Ca2+ without (1.8 Ca) or with (1.8Ca + U73122) the addition of a specific phospholipase C inhibitor U73122 (10 μM). J: summarized data (means ± SE) showing the current-voltage (I-V) relationship curves constructed from current recordings in HEK293 cells co-transfected with KCNA5/CASR constructs before (0 Ca) and during extracellular application of 1.8 mM Ca2+ without (1.8 Ca) or with (1.8Ca + U73122) the addition of U73122; n = 5 cells for each group. P < 0.01 between the 1.8Ca curve and the curves of 0Ca and 1.8Ca + U73122 (ANOVA).

