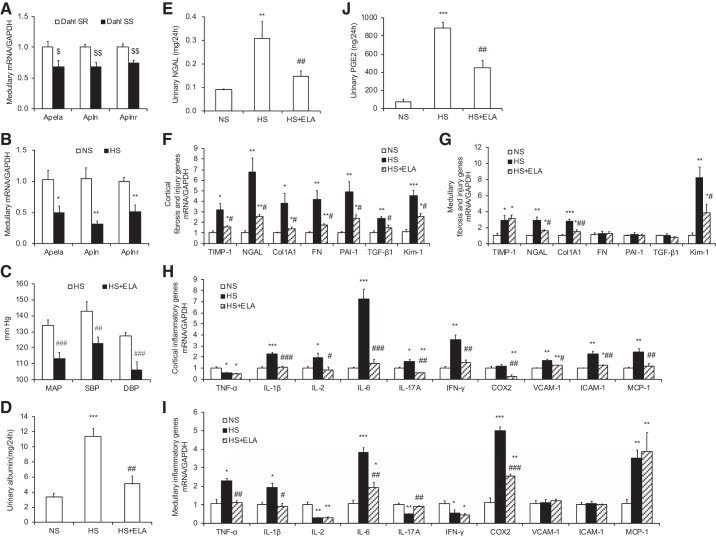
Fig. 5.
ELA-32 suppresses high salt (HS)-induced hypertension, fibrosis, inflammation, and oxidative stress in Dahl salt-sensitive (SS) rats. A: quantitative RT-PCR results of medullary Apela, Apln, and Aplnr mRNA expression in the kidneys of Dahl salt-resistant (SR) rats and Dahl SS rats; expression was normalized by GAPDH. B: quantitative RT-PCR results of medullary Apela, Apln, and Aplnr mRNA expression in the kidneys of normal Na+ (NS)- and HS-loaded Dahl SS rats; expression was normalized by GAPDH. C: effect of ELA-32 on HS-induced hypertension in Dahl SS rats. All rats were subjected to a high-salt diet for 14 days. Radiotelemetry was performed to record mean arterial pressure (MAP), systolic blood pressure (SBP), and diastolic blood pressure (DBP). D: urinary albumin excretion. E: urinary neutrophil gelatinase-associated lipocalin (NGAL) excretion. F and G: quantitative RT-PCR analysis of fibrosis genes, including TIMP-1, NGAL, Col1A1, FN, PAI-1, TGF-β1, and Kim-1 mRNA expression in the kidney cortical (F) and medullary (G); expression was normalized by GAPDH. H and I: quantitative RT-PCR analysis of inflammatory genes, including TNF-α, IL-1β, IL-2, IL-6, IL-17A, IFN-γ, COX-2, VCAM-1, ICAM-1, and MCP-1 mRNA expression in the kidney cortical (H) and medullary (I); expression was normalized by GAPDH. J: urinary PGE2 excretion. Male Dahl SR rats and Dahl SS rats were used in these studies. n = 5 Rats per group. Data are means ± SE. $P < 0.05, $$P < 0.01 vs. Dahl SR; *P < 0.05, **P < 0.01, ***P < 0.001 vs. NS; #P < 0.05, ##P < 0.01, ###P < 0.001 vs. HS. Statistical analysis was performed by using unpaired Student’s t test (A–C) or 1-way analysis of variance with the Bonferroni test (D–J) using IBM SPSS 19 software. ELA, ELABELA.

