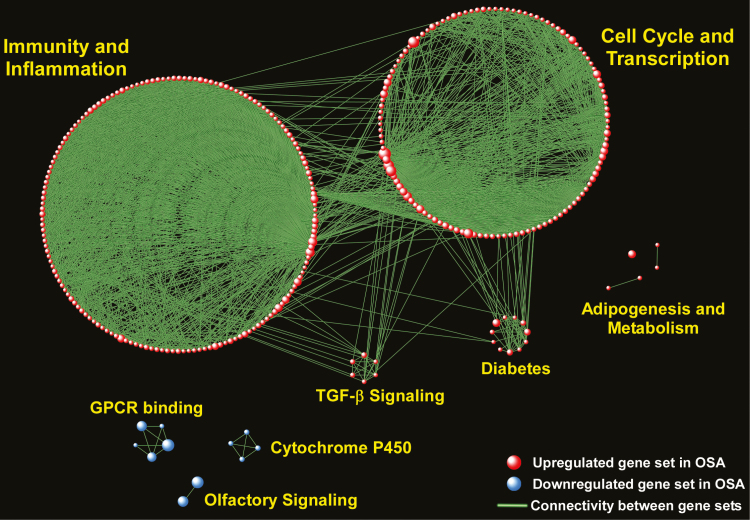
Figure 2.
Network-based visual depiction of gene set enrichment analysis (GSEA) of subcutaneous fat tissue in OSA subjects vs. those without OSA. Red spheres correspond to gene sets up-regulated and blue spheres to gene sets down-regulated in OSA. Connectivity between the gene sets is based on 25% or greater overlap among their member genes. Note that the topology of the network is characterized by the emergence of biological modules comprises of highly interconnected gene sets with similar functional themes. Notable modules up-regulated in OSA include “Immunity and Inflammation,” “Cell Cycle and Transcription,” “Adipogenesis,” “Diabetes,” TGF-β Signaling,” whereas down-regulated modules include “Olfactory Signaling,” “GPCR Binding,” and “Cytochrome P450.” Complete list of enriched gene sets in included in Supplementary Tables S2 and S3.

