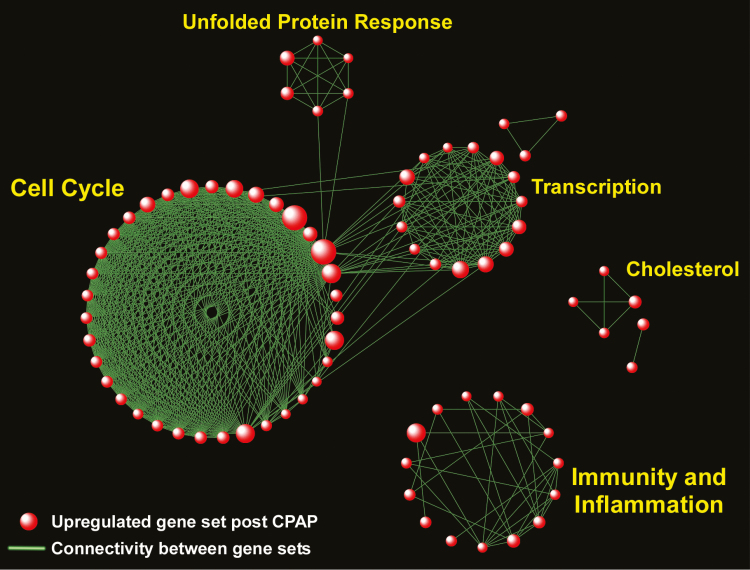
Figure 5.
Network-based visualization of gene set enrichment analysis of subcutaneous fat tissue in OSA subjects following treatment with CPAP. Red spheres correspond to pathways up-regulated following CPAP therapy. No pathway was significantly down-regulated post-CPAP. Note the emergence of several biological modules in response to CPAP, including “Immunity and Inflammation,” “Cell Cycle,” “Transcription,” “Unfolded Protein Response,” and “Cholesterol.” Complete list of enriched gene sets in included in Supplementary Table S8.

