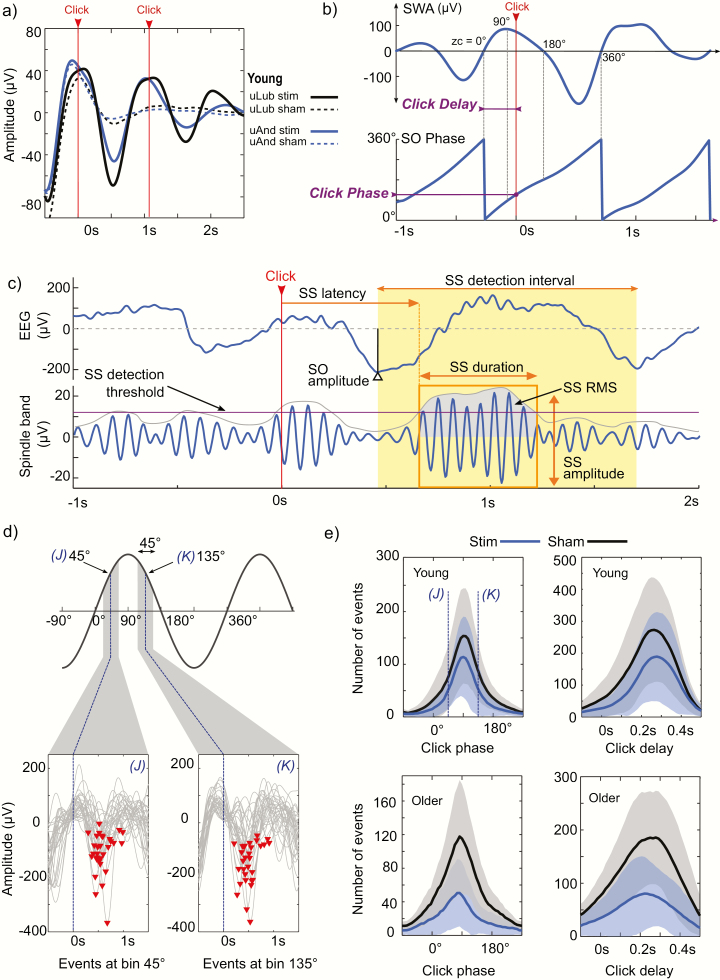
Figure 1.
Description of datasets and analysis methods. (a) Stimulation protocols were similar in all datasets. Two clicks marked by the vertical arrow lines were presented in the predicted up-state. All datasets presented similar ERPs with increased SOs amplitude for the STIM condition. (b) The delay from the zero-crossing to the click time (vertical arrow line) and the corresponding click phase were obtained and used as reference points for further analysis. For SO wave phase, 0° states the negative to positive zero-crossing (ZC), −90° and 270° represent the SO troughs and 90° the SO peak of the trace. (c) Detection of sleep spindles (SS) as well as SO and SS measurements used in the analysis. Only SS that start in the detection interval were analyzed (yellow shadow). (d) For the detected and stimulated SOs, the trough-to-trough interval in both phase and time was divided into 50 bins. For instance, in the phase analysis, trials in which the stimulation was applied 45° around the bin centre were selected and comprise the events of each bin. Here we show 30 events of one young subject around the 45° bin (J) and 135° bin (K). (e) Histograms of detected events for all datasets. As CLAS targets SO peaks, the distribution of events is not even across all bins, 45° bin (J) and 135° bin (K) are also depicted for reference. Shaded areas represent subject mean ± SD.

