Figure 2.
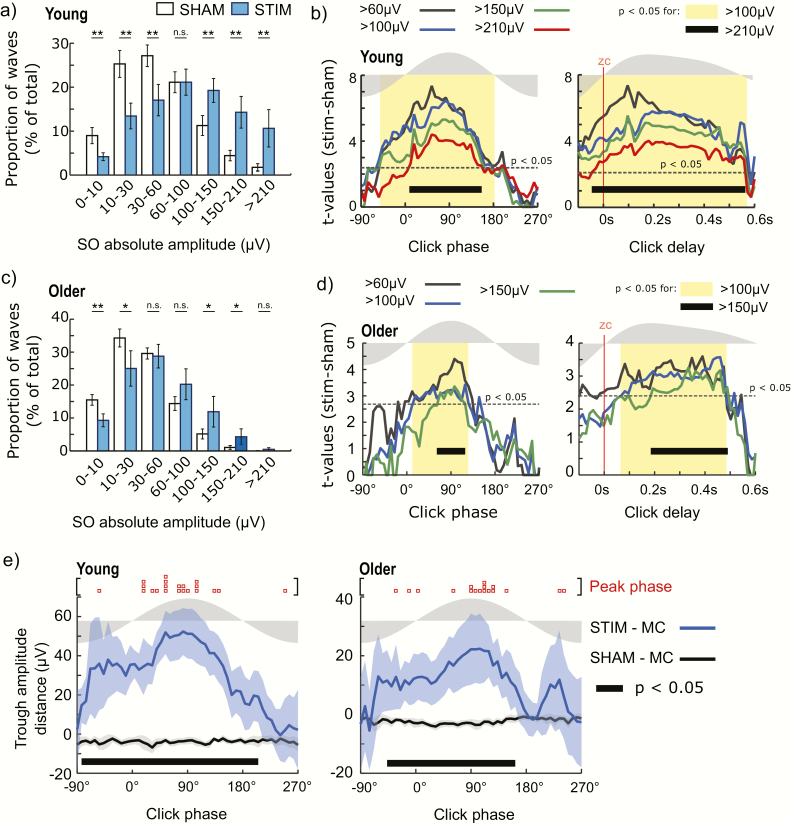
Slow-wave amplitudes after CLAS in young and old subjects. (a) Distribution of the post-stimulus absolute trough amplitude of SOs during SHAM (white bars) and STIM (blue bars) in young subjects. (b) Size of the difference between STIM and SHAM for post-stimulus SO amplitudes for clicks applied at different phase/delay-bins for young people. Dotted line represents the significance threshold for p < .05 after FDR correction. Yellow shadow indicates intervals for which a significant increasing of >100 µV amplitudes was found. Click delay was evaluated from the negative to positive zero-crossing (zc). For reference, the gray shading on top of the axes displays the morphology of the average SO wave. (c) Distribution of the post-stimulus trough amplitude of slow waves during SHAM and STIM conditions for older subjects. (d) Size of the difference between STIM and SHAM for post-stimulus trough amplitudes for clicks applied at different phase/delay-bins for older people. (e) Absolute distance (mean ± 95% CI) of post-stimulus trough amplitudes to spontaneous activity over different phase bins for SHAM vs. Monte Carlo (SHAM—MC) and STIM vs. Monte Carlo (STIM—MC). Thick black bars show phase intervals in which significant differences were observed at p < .05 after FDR correction. Red squares remark maximal significant distance for each subject after corrected p < .05. (*) p < .05 and (**) p < .01 after FDR correction; (n.s.) for nonsignificant.

