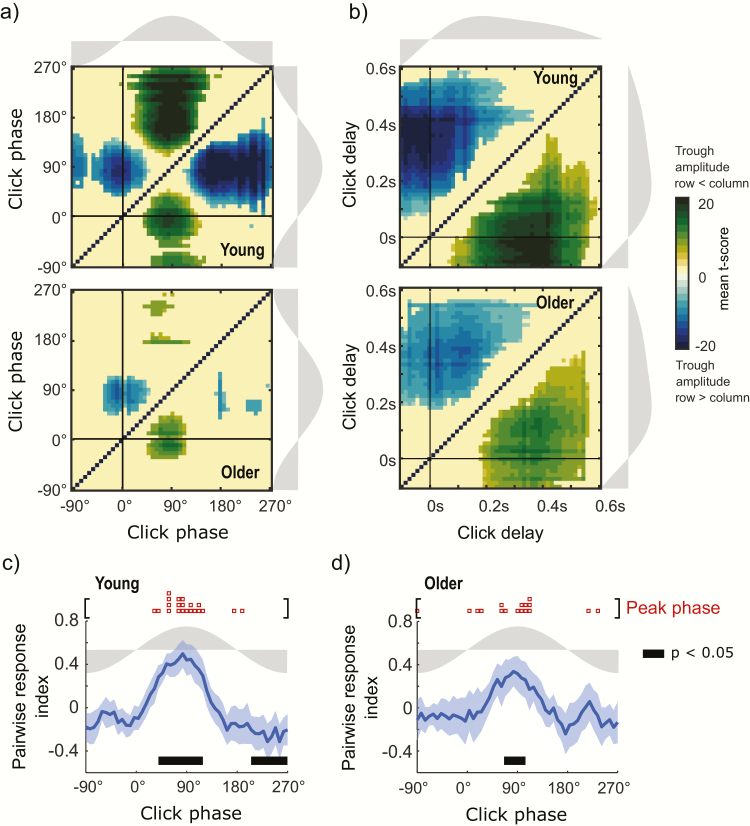
Figure 3.
Pairwise comparison for SO trough amplitude in STIM condition. (a, b) Pairwise comparison matrix for post-stimulus trough amplitude events evaluated in click phase and click delay bins for young (a) and older subjects (b). X and Y axis represent the same bins comparing each point to every other point. Matrix values correspond to the mean size of the difference (t-values) of bin pairwise comparisons significant after FDR correction. (c, d) Pairwise response index (mean ± 95% CI) for click phases for young (c) and older subjects (d). Thick black bars show phase intervals in which significant differences were observed at p < .05 after FDR correction.

