Figure 3.
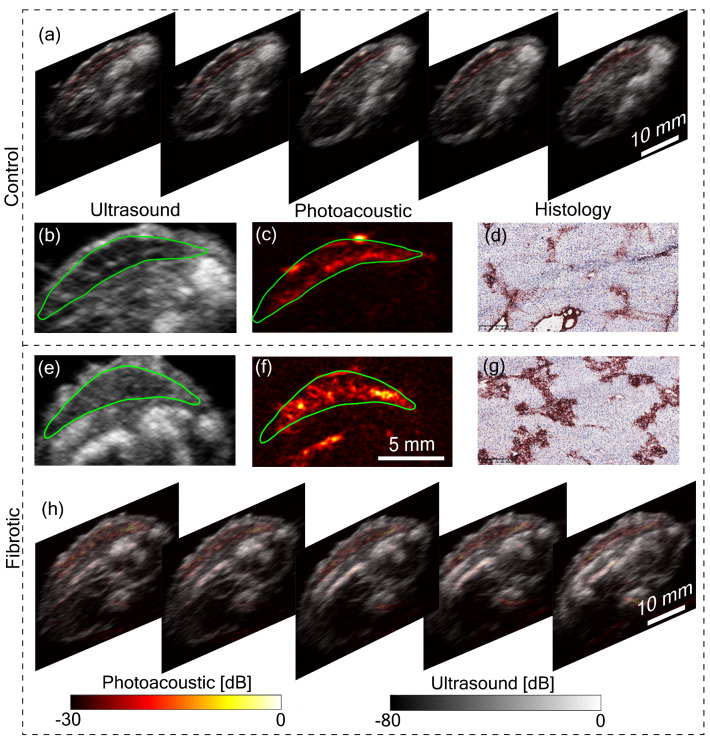
Tomographic imaging of the liver. (a) Tomographic photoacoustic and ultrasound images of a control mouse showing the liver at a scanning step of 2 mm. (b) Ultrasound image of the liver and (c) corresponding photoacoustic image. The green line markers the liver region. (d) Histology image of the control liver stained with Collagen I (fibrosis marker). (e) Ultrasound image of a mouse liver with fibrosis (CCl4-treated) and (f) corresponding photoacoustic image. (g) Histology image of the fibrotic liver stained with collagen I (fibrosis marker). (h) Tomographic photoacoustic and ultrasound images of the fibrotic mouse showing liver at a scanning step of 2 mm.

