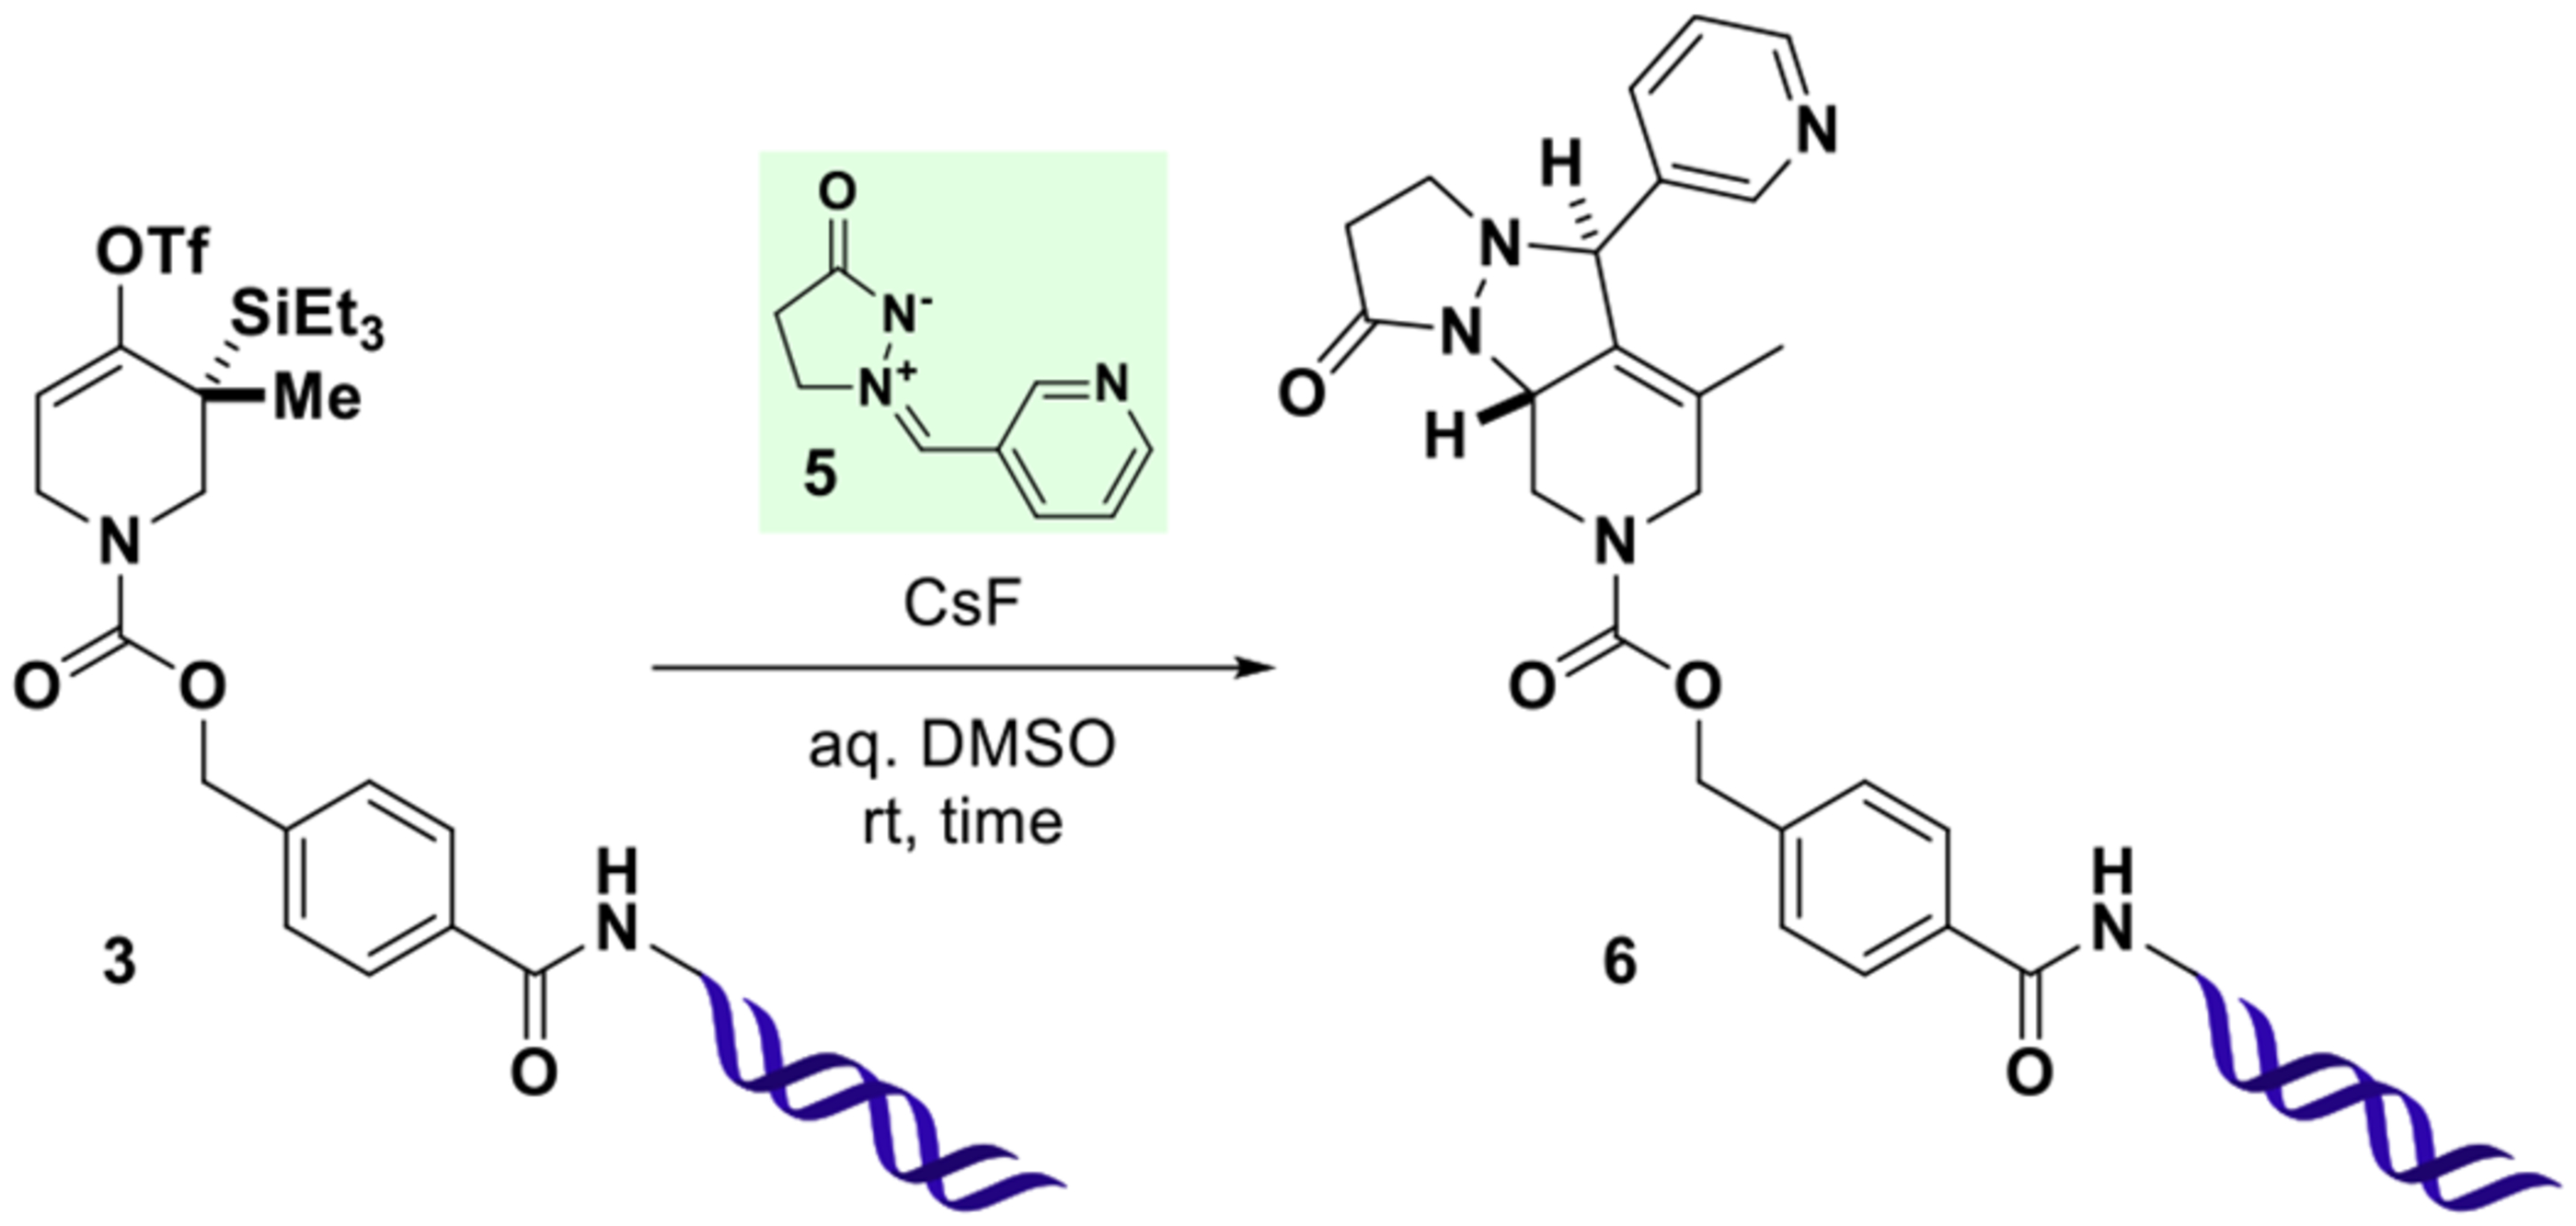
Table 1.
Formation and Trapping of a DNA-Conjugated Strained Allenesa
 | ||||||
|---|---|---|---|---|---|---|
| # | 5 [mM] | CsF [mM] | %DMSO | t [h] | 3 [%] | 6 [%] |
| 1 | 15 | 50 | 25 | 24 | 100 | 0 |
| 2 | 15 | 50 | 50 | 24 | 97 | 3 |
| 3 | 15 | 50 | 75 | 24 | 0 | 100 |
| 4 | 100 | 1000 | 50 | 1 | 2 | 98 |
| 5 | 100 | 500 | 50 | 1 | 28 | 72 |
| 6 | 100 | 750 | 75 | 1 | 1 | 99 |
| 7 | 100 | 375 | 75 | 1 | 28 | 72 |
| 8 | 15 | ~6 | 90 | 1 | 0 | 100 |
| 9 | 15 | ~3 | 90 | 1 | 27 | 73 |
| 10 | 2 | 50 | 90 | 12 | 0 | 100 |
| 11 | 1 | 50 | 90 | 12 | 0 | 95 |
| 12 | 0.5 | 50 | 90 | 12 | 0 | 84 |
Reactions were performed at room temperature with 3(0.5 nmol) in a total volume of 10 μL for the indicated time. Following ethanol precipitation, residual 3and newly formed 6were detected by UPLC-MS and quantified (%AUC) by integration of UV chromatograms (260 nm) considering DNA-species only. The relative configuration of the two newly formed stereogenic centers in 6indicates the expected major product as observed in off-DNA precedence.37 For additional data, see SI, Table S1.
