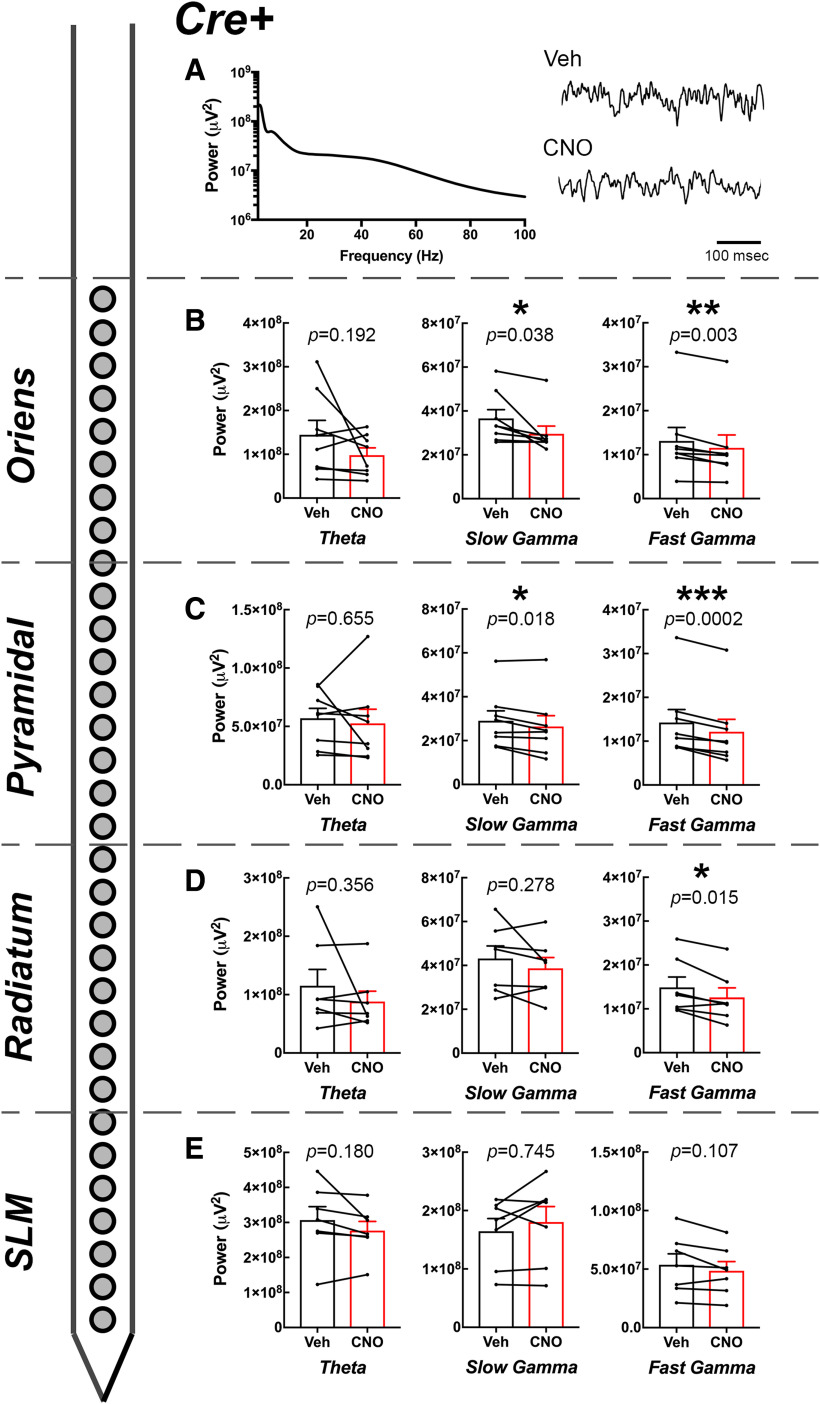
Figure 3.
Effect of CNO on CA1 oscillatory power by layer in Amigo2-icreERT2+ animals. A, Example PSD from the pyramidal cell layer of an Amigo2-icreERT2+ animal and raw LFP traces collected following either vehicle or CNO (3 mg/kg) treatment. B–E, Theta, slow γ, and fast γ powers measured from each layer of CA1 as indicated by the schematized shank electrode and layer of CA1 listed on the left. For each graph, population means and SEMs are represented as colored bars (black = vehicle; red = CNO), and dots connected by lines represent data from individual animals for each treatment. Specific p values from paired t tests are shown over each graph; *p < 0.05, **p < 0.01, ***p < 0.001.

