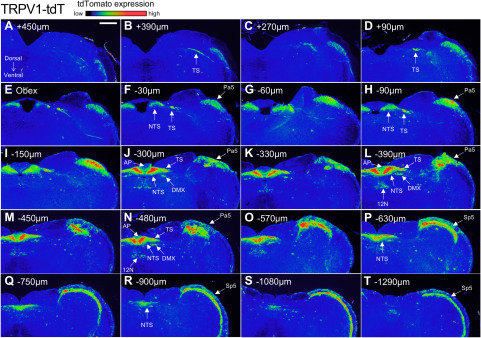
Figure 10.
tdTomato expression in serial coronal sections of the medulla in TRPV1-tdT. A–T, Data presented from rostral to caudal, with labeling for the position relative to obex. The intensity of native tdTomato expression is shown in rainbow pseudocolor. The following structures are identified: area postrema (AP), DMX, 12N, nTS, Pa5, Sp5, and TS. Scale bar, 400 μm. Data are representative of n = 6 animals.

