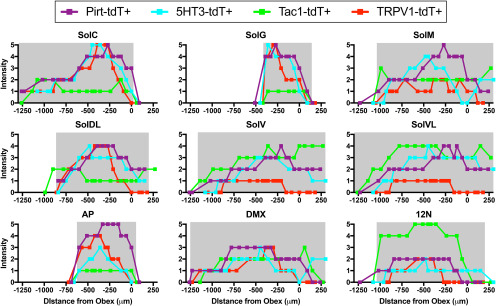
Figure 14.
tdTomato expression in dorsal medulla subnuclei along complete rostral–caudal axis. Data are mean native tdTomato intensity in SolC, SolG, SolM, SolDL, SolV, SolVL, area postrema (AP), DMX, and 12N from Pirt-tdT (purple), 5-HT3-tdT (cyan), TRPV1-tdT (red), and Tac1-tdT (green; n = 5–8 mice each). The gray shading represents the physical dimensions of each subnuclei in the rostral–caudal axis (positive values denote rostral of obex, negative values denote caudal of obex; Paxinos and Franklin, 2012).

