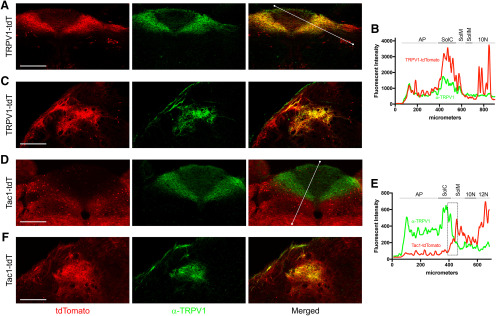
Figure 15.
Overlap of native tdTomato expression and α-TRPV1 immunoreactivity in the medulla of TRPV1-tdT and Tac1-tdT. A–C, TRPV1-tdT at −300 μm (relative to obex). D–F, Tac1-tdT at −240 μm. A, C, D, F, tdTomato expression (red) is compared with α-TRPV1 immunoreactivity (green) in the nTS (A–D) and the Pa5 (C–F), with merged image on the right. Scale bar, 250 μm. B, Quantification of tdTomato (red) and α-TRPV1 immunoreactivity (green) intensities along the line drawn in the merged image in A (TRPV1-tdT nTS), including area postrema (AP), dorsal motor nucleus of the vagus (10N), SolC (C), SolIM (IM), and SolM (M). E, Quantification of tdTomato (red) and α-TRPV1 immunoreactivity (green) intensities along the line drawn in the merged image in D (Tac1-tdT nTS), including AP, 10N, 12N, C, and M. Boxed area denotes overlap of tdTomato and α-TRPV1 immunoreactivity intensities along the border between SolC and SolM. Data are representative of n = 3 animals for each strain.

