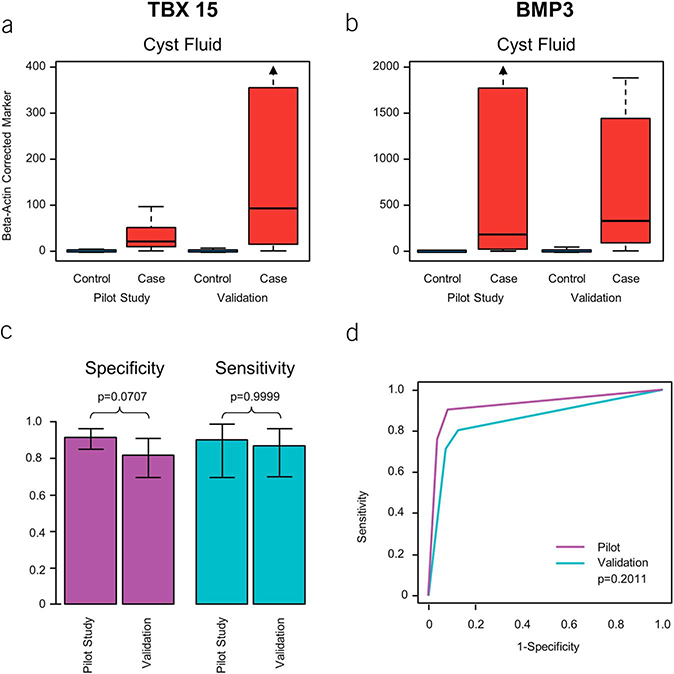
Figure 6.
Comparative results of CF pilot and validation study. (a and b) CF distributions of TBX 15 and BMP 3 from cases (HGD or cancer) and controls (LGD or no dysplasia) in pilot study and subsequent validation. (c) Sensitivities and specificities of the 2-MDM panel. (d) AUCs for the 2-MDM panel in independent pilot and validation sets. AUC, areas under the receiver operating characteristic curve; CF, cyst fluid; HGD, harbor high-grade dysplasia; LGD, low-grade dysplasia; MDM, methylated DNA marker.

