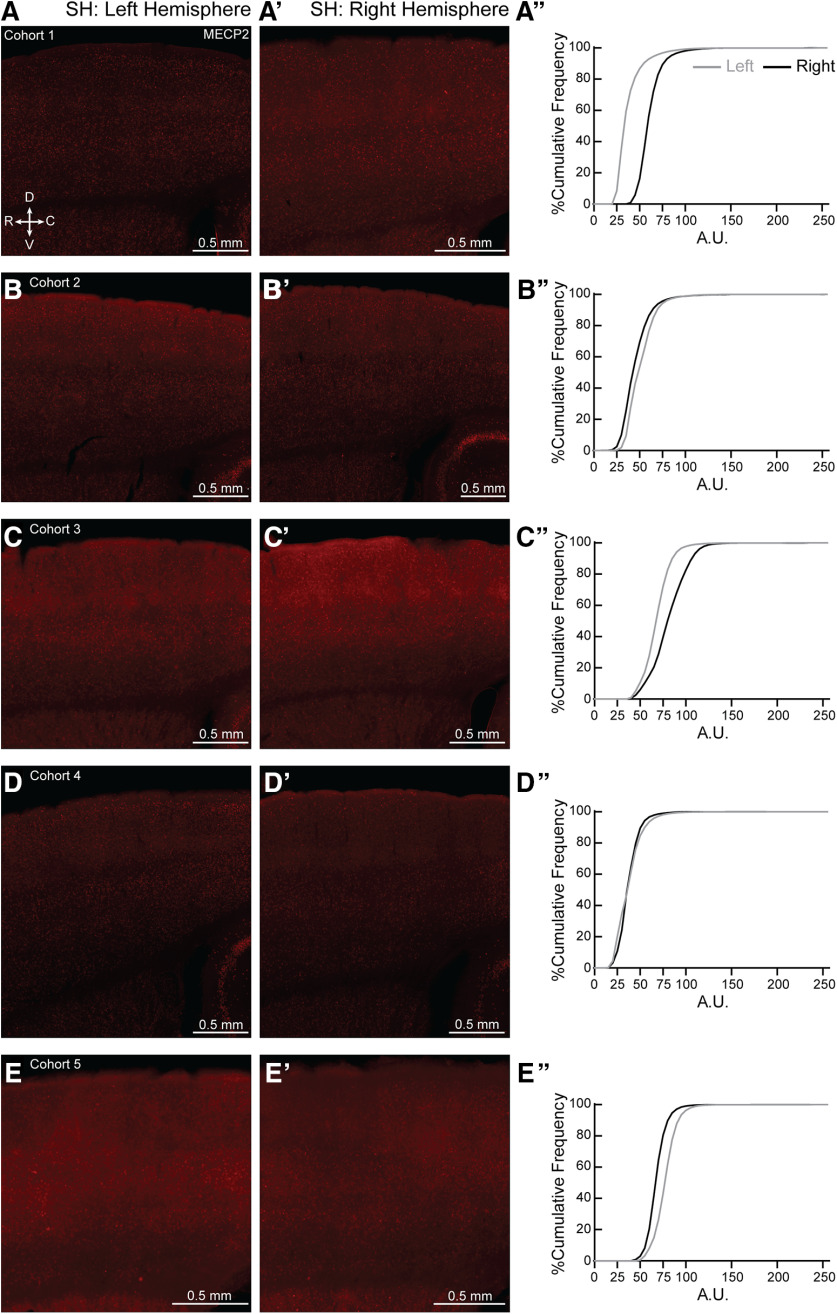
Figure 12.
Hemispheric bias for MECP2 expression in individual SH brains. (A–E, A′-E′) Representative 20X magnification, tiled projection epifluorescent images showing MECP2 expression in left (A–E) and right (A′-E′) SS1 of SH from cohorts 1-5. R = rostral, C = caudal, D = dorsal and V = ventral. (A′′-E′′) Percentage cumulative frequency distribution of MECP2 intensity within left (grey) and right (black) SS1 of the corresponding SH cohorts. Cohort 1 and 3 (A′′ and C′′, respectively) expressed more MECP2 in the right hemisphere than the left. Cohorts 2 and 5 (B′′ and E′′, respectively) expressed slightly more MECP2 in the left hemisphere than the right, while cohort 4 (D′′) showed similar MECP2 expression in both hemispheres. A.U. = arbitrary intensity unit. N = 1 image per hemisphere.

