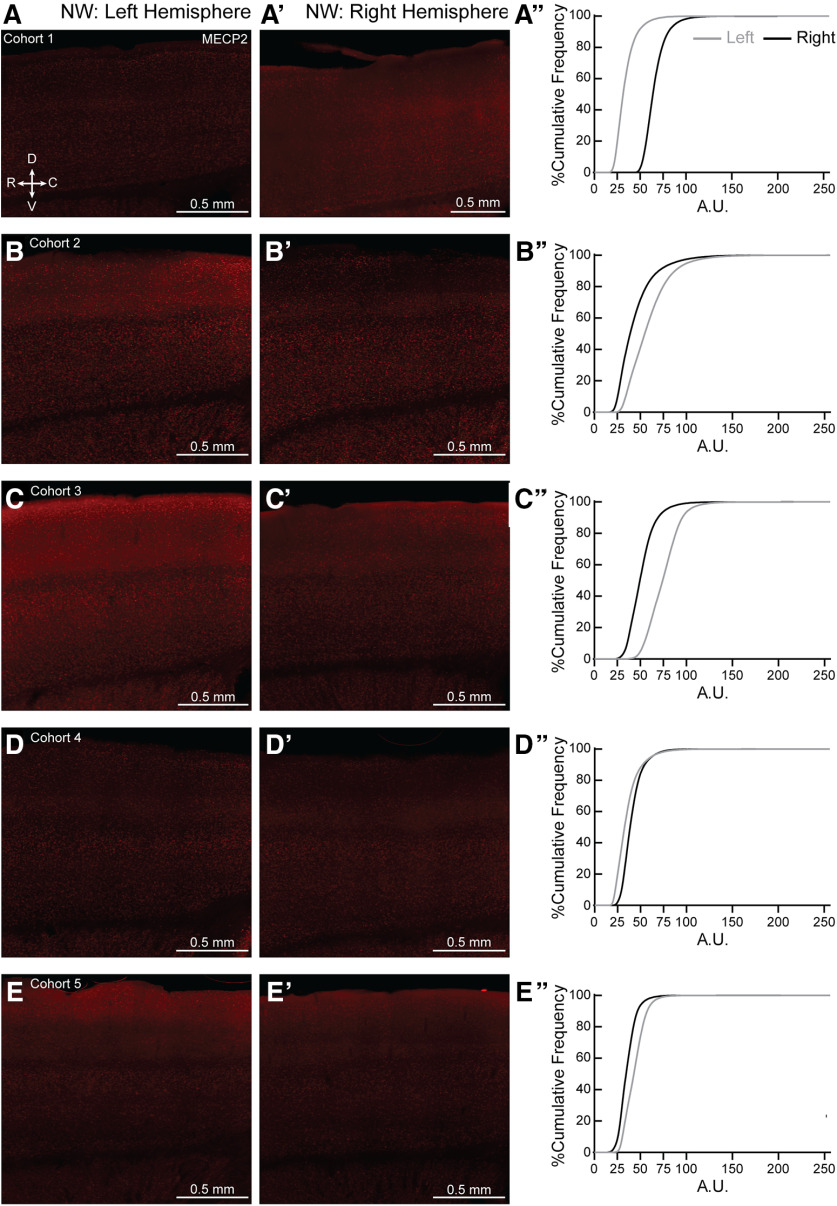
Figure 13.
Hemispheric bias for MECP2 expression in individual NW brains. (A–E, A′–E′) Representative 20X magnification, tiled projection epifluorescent images showing MECP2 expression in left (A–E) and right (A′–E′) SS1 of NW from cohorts 1-5. R = rostral, C = caudal, D = dorsal and V = ventral. (A′′–E′′) Percentage cumulative frequency distribution of MECP2 intensity within left (grey) and right (black) SS1 of the corresponding NW cohorts. Cohort 1 and 4 (A′′ and D′′, respectively) expressed more MECP2 in the right hemisphere than the left. Cohorts 2, 3 and 5 (B′′, C′′ and E′′, respectively) expressed more MECP2 in the left hemisphere than the right. A.U. = arbitrary intensity unit. N = 1 image per hemisphere.

