Figure 2.
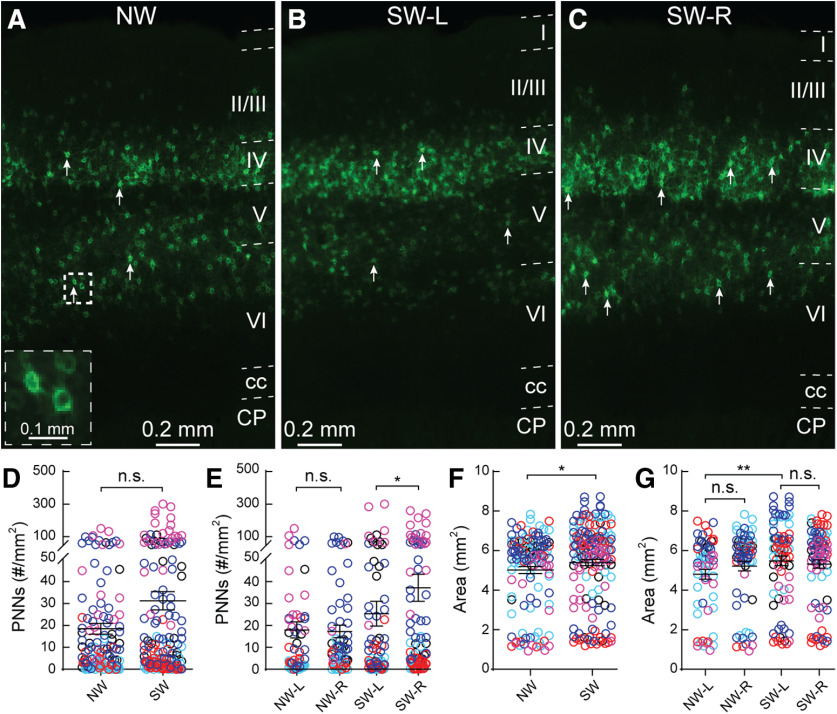
Surrogate Mecp2WT (Wild type) mice exhibit hemisphere specific increase in PNN density in the primary somatosensory cortex (SS1). (A-C) Representative epifluorescent images of PNN expression in SS1 of naïve WT (NW) (A) as well as left (L) (B) and right (R) (C) hemispheres of surrogate WT (SW). Layers 1 through 6 are outlined. CP = caudate putamen and cc = corpus callosum. Arrows indicate examples of high-intensity PNNs analyzed for the study. Inset in A shows magnified PNN structures in the box. (D) Combined hemisphere analysis of the density of high-intensity PNNs was not significantly different between NW and SW (NW: n = 123 images; SW: n = 162; Mann-Whitney test, p > 0.05). (E) Separate analysis of left and right hemisphere revealed a significant increase of high-intensity PNNs in the right hemisphere of SW (SW-R; n = 81 images) compared to the left hemisphere of SW (SW-L; n = 81 images) (Kruskal-Wallis followed by Dunn’s test, *p < 0.05), while no significant difference was observed between hemispheres of NW (NW-L: n = 59 images; NW-R: n = 64 images; Mann-Whitney test, p > 0.05). (F,G) Size of SS1 was overall significantly larger in SW compared to NW (F) (NW: n = 123 images; SW: n = 162 images; Mann-Whitney test, *p < 0.05). Enlargement of SS1 in SW occurred in the left hemisphere (G) (NW-L: n = 59 images, NW-R: n = 64 images; SW-L: n = 81 images; SW-R: n = 81 images; Kruskal-Wallis followed by Dunn’s test, **p < 0.01). For D-G, n.s. = not significant. Different colors represent each of the five cohorts. Each open circle represents PNN density in an individual brain section.

