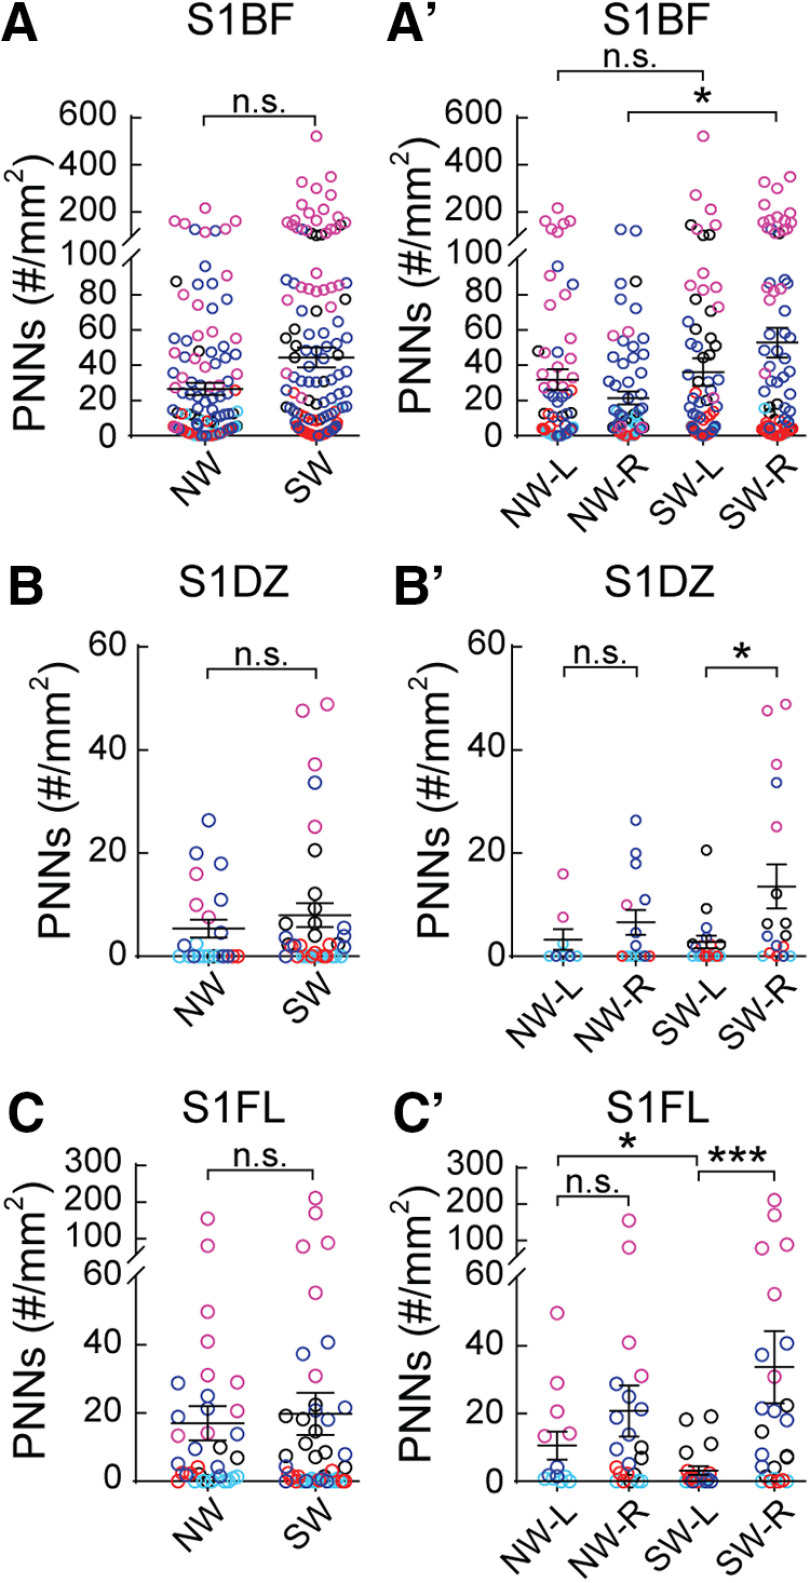
Figure 4.
PNN density varies across subregions of WT SS1. (A–C) Analysis of both hemispheres for SS1 barrel field (S1BF, A), dysgranular zone (S1DZ, B) and forelimb (S1FL, C) revealed no significant differences between NW and SW (S1BF: NW – n = 131 images, SW - n = 168 images; S1DZ: NW − n = 22 images, SW – n = 35 images; S1FL: NW − n = 35 images, SW − n = 46 images; 5 mice per condition; Mann-Whitney test, p > 0.05, n.s. = not significant). (A′–C′) Analysis of sub regional SS1 by hemispheres revealed dynamic changes in PNN expression. In S1BF (A′), a significant increase of PNN expression was detected in the right hemisphere of SW (SW-R) compared to NW (NW-R) (NW-L: n = 65 images; NW-R: n = 66 images; SW-L: n = 85 images; SW-R: n = 83 images). In S1DZ (B′), while no significant difference was observed in PNN density between hemispheres in NW, there was a significant increase of PNN density in the right hemisphere (SW-R) compared to the left (SW-L) (NW-L: n = 8 images; NW-R: n = 14 images; SW-L: n = 18 images; SW-R: n = 17 images). A similar pattern of PNN plasticity was also detected in S1FL (C′), where PNN density was significantly increased in the right hemisphere than the left of SW. Interestingly, SW-L exhibited significantly lower PNN density compared to NW-L (Figure 4C′; NW-L: n = 13 images; NW-R: n = 22 images; SW-L: n = 21 images; SW-R: n = 25 images). For A′-C′, 5 mice per condition; Kruskal-Wallis followed by Dunn’s test, *p < 0.05, ***p < 0.001, n.s. = not significant.

