
Figure 8.
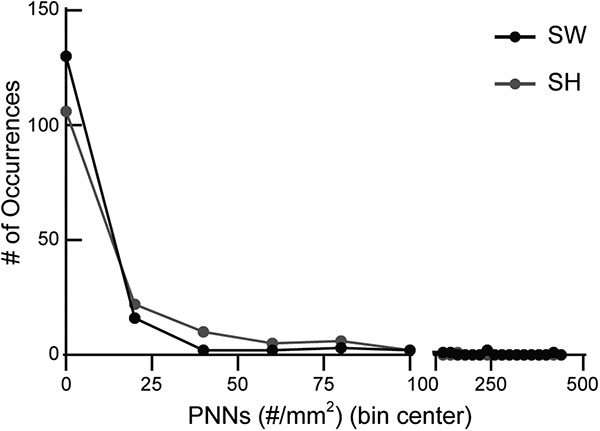
Significant difference in S1 PNN density between SH and SW in Table 1 due to differential distribution. Histogram analysis showed that SW had more occurrences of 0 PNN density compared to SH, as shown by black dot (SW) above grey dot (SH). SH had more occurrences of 20–80 PNN density than SW, as shown by grey dots (SH) above black dots (SW). The average PNN density values of SW (n = 160 images) and SH (n = 152 images) are similar (Table 1) (5 mice per condition), but they are statistically different due to this differential distribution of data.