Figure 3.
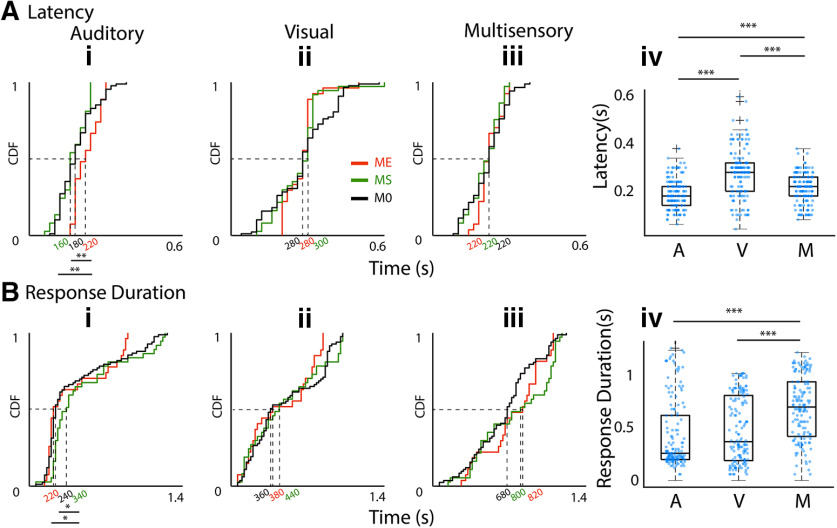
Dependence of latency and response durations of OFC units to A, V, M stimuli. Ai–iii, CDF plots of latencies of OFC single units with different types of modulations (identified by shading of lines) to A, V, and M (i–iii) stimuli. Aiv, Box plots of latencies of all single units to each of the stimuli, A, V, and M. Bi–iv, Same arrangement of CDF plots and box plots as in A for response duration. ***p < 0.001.

