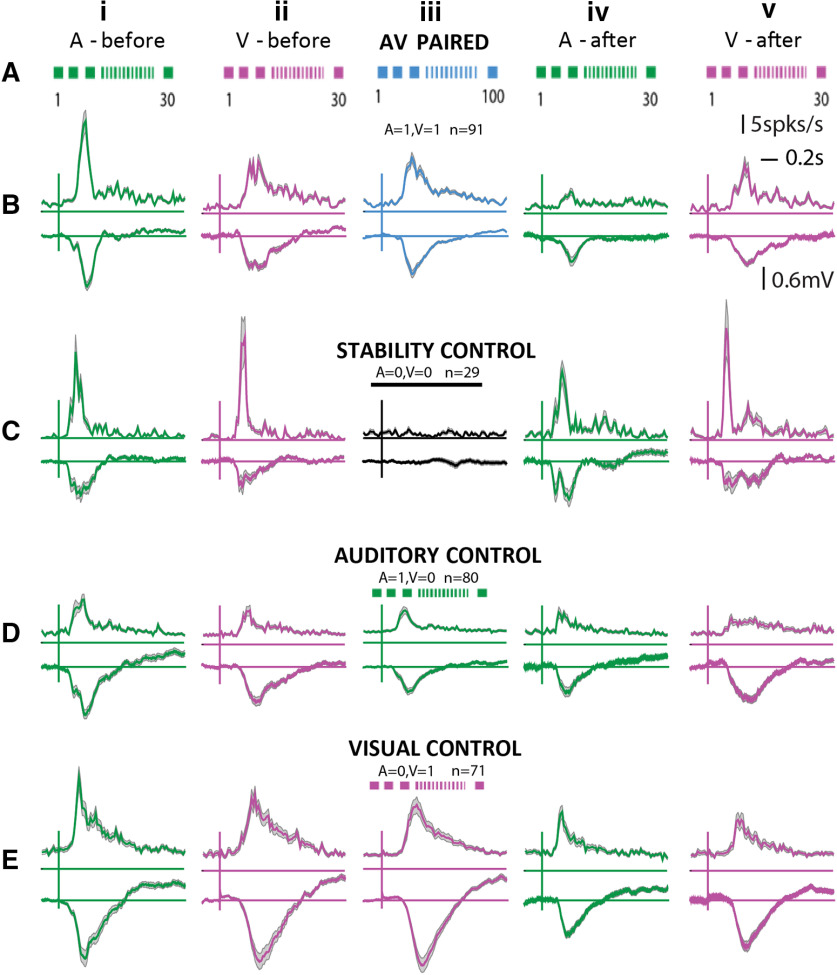
Figure 7.
Population effects of audiovisual associations in the OFC. Row A, Experimental protocol is displayed in cartoon form along with reponse PSTHs for the same conditions. B–E, Each row shows PSTHs with SEM of populations of OFC single neurons combined across different experiments. Row B, Case of audiovisual pairing. Row C, Stability control (no exposure in between). Row D, Auditory only control. Row E, Visual only control. First two columns of all rows show mean responses (to 30 iterations) to A and V before the A-V pairing (or each of the control exposure), and the last two columns of all rows show the same after A-V pairing (or each of the control exposure). The middle column shows mean responses (to 100 iterations) during the A-V pairing (or each control exposure).

