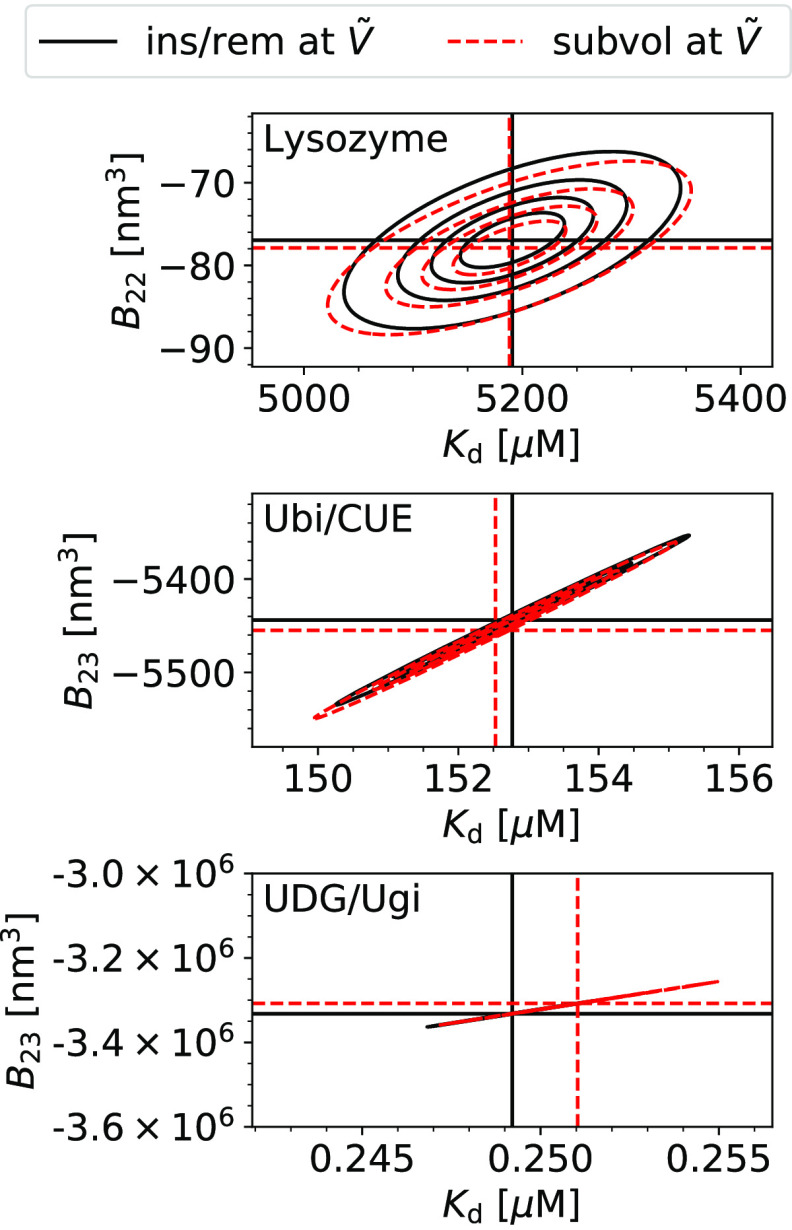
Figure 2.
Comparison of the accuracy of the insertion/removal method (ins/rem, black, solid lines) and the subvolume method (subvol, red, dashed lines) to estimate Kd and Bij for three different protein pairs (top to bottom). The most likely estimates are indicated by horizontal and vertical dashed lines. The contour lines indicate the limits of the 25, 50, 75, and 95% confidence regions. The insertion/removal method (eqs 14 and 1 and the two-particle partition function from WHAM (Section 2.6.1), black) and the subvolume method (eqs 26 and 1, red) agree excellently with each other, and they have similar uncertainties. For UDG/Ugi, contour lines collapse on to a single line due to the strong correlation between the estimates for Kd and Bij.

