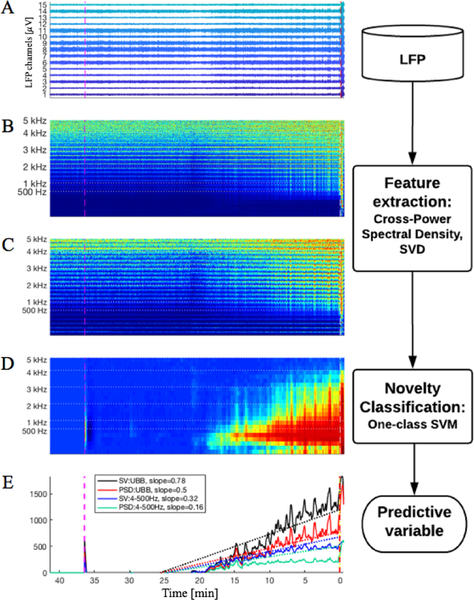
Fig. 1.
Illustrates the process flow done by the algorithm. For all panels the pink line marks chemoconvulsant application, x-axis denotes time in minutes, the onset of the first seizure is marked at 0. A, shows the LFP recordings for all channels. B, illustrates the PSD across all frequencies. C, plots the Singular Values (SV) from the CSPD, for all frequency bands. D, shows the output of the one-class SVMs per frequency band. For D, the one-class SVM is trained using SV. In E, the sums of the SVM outputs are plotted in the four different configurations tested with their respective line fit. SV and PSD denote if the one-class SVM is trained using either the singular values or the PSD from each channel. UBB indicates if the sum is done over all 23 frequency bands, the ultra broad band (4 Hz – 5 kHz). Otherwise, the sum is done over the first 6 frequency bands (4 – 500 Hz).

