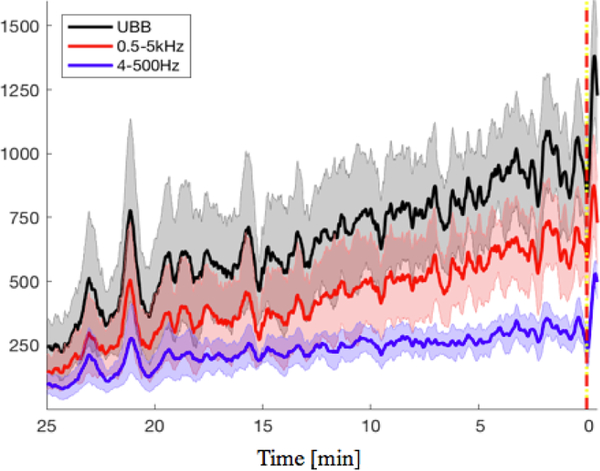
Fig. 3.
Shows the traces of sums of the SVM outputs for four experiments. The trace starts 25 minutes before seizure onset, until 30 seconds after onset. The yellow/red line denotes the seizure onset at zero. In black, the sum of the SVM outputs across the whole UBB is shown. In red, the sum trace for frequency bands above 500 Hz, and in blue for frequency bands between 4 to 500 Hz. Shaded regions show the standard error mean of each trace.

