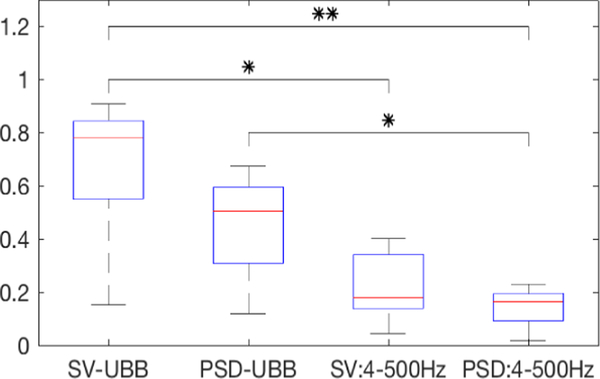
Fig. 4.
Shows the slope distribution for the four different configurations tested. SV and PSD denote if the one-class SVM is trained using either the singular values from the CSPD or the PSD from each channel. UBB indicates if the sum is done over all 23 frequency bands, the ultra broad band (4 Hz – 5 kHz). Otherwise, the sum is done over the first 6 frequency bands (4 – 500 Hz).). For the paired t-test (N=5); *, ** denote statistical significance at p < 0.05 and p < 0.01 respectively.

