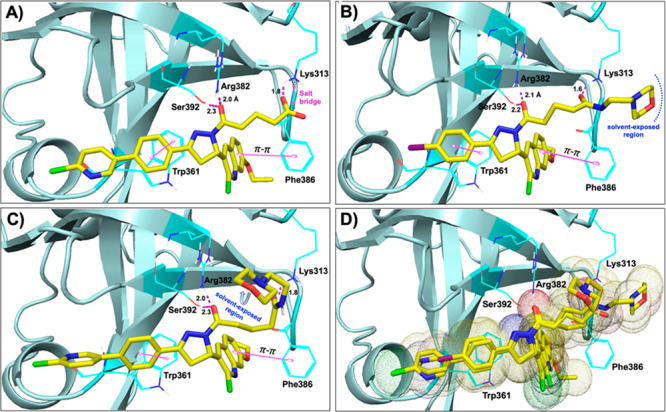
Figure 3.

Molecular docking studies (PDB code: 1FGU):29 (A–C) Molecular interactions of compounds 26 (A), 42 (B), and 45 (C) (all in yellow carbon) with hRPA (key amino acids are shown in dark cyan carbon and cartoon is shown in pale cyan color). Interaction with amino acid side chains is indicated with the dashed magenta lines, π–π stacking interactions are shown in solid magenta dumbbell, and salt-bridge interactions are shown in dashed two-sided magenta arrow. Interaction distances indicated in Å. (D) Molecular overlay (superimposition) of compounds 26, 42, and 45 (all in yellow carbon) in the RPA binding site.
