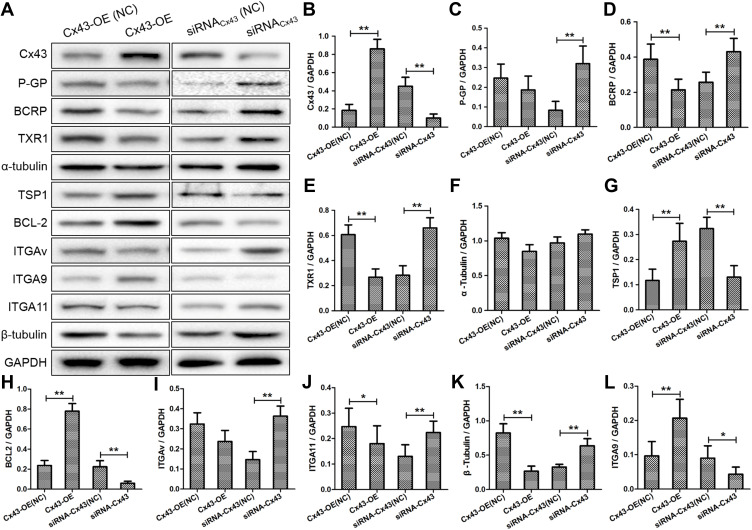
Figure 4.
(A) Western blot analyses the protein levels of Cx43, Txr1, α-tubulin, β-tubulin, BCRP, P-gp, TSP-1, Bcl-2, ITGα9, ITGα11 and ITGαV in Cx43-OE group and Cx43-OE (NC) group, Cx43-siRNA group and Cx43-siRNA (NC) group treated with paclitaxel. (B–L) Quantitative analysis of protein levels. *p<0.05, **p<0.01.

