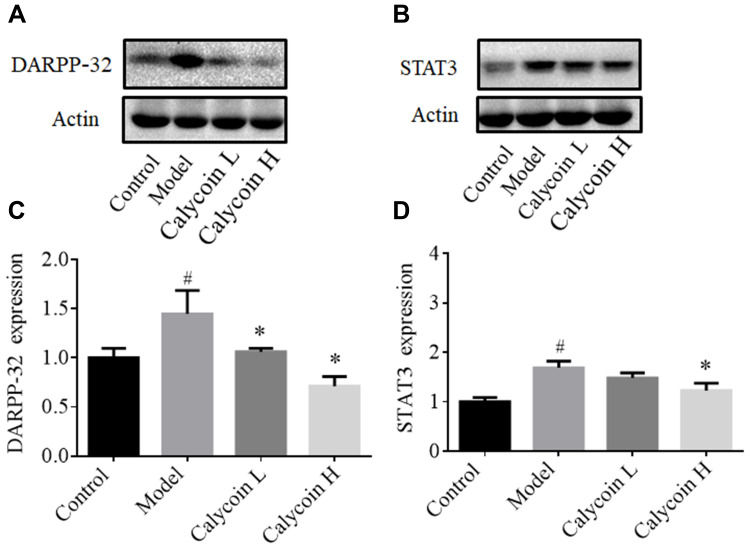
Figure 8.
Effects of calycosin on DARPP-32, and STAT3 expression in gastric mucosa of PLGC rats. (A and B) Western blot analysis of DARPP-32 and STAT3 protein levels in PLGC groups after treatment with calycosin. (C and D) Quantitative analysis of DARPP-32 (A) and STAT3 (B). Expression was standardized to actin expression. Data are shown as the mean ± SD (n = 3 rats per group). #P < 0.05 versus the control group. *P < 0.05 versus the model group.

