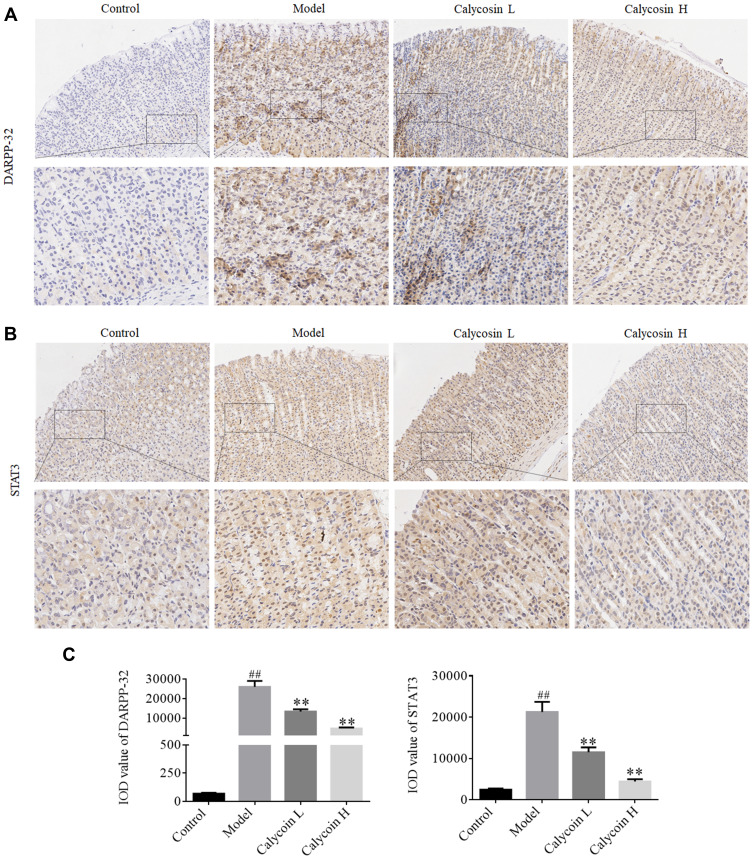
Figure 9.
(A) Expression of DARPP-32 in gastric mucosa of each group detected by IHC staining (20×, 40×). (B) Expression of STAT3 in gastric mucosa tissue of each group detected by IHC staining (20×, 40×). (C) Immunohistochemical expression of DARPP-32 and STAT3 shown as IOD value, which was determined by Image-Pro Plus. Data are shown as the mean ± SD (n = 3 rats per group). ##P < 0.01 versus the control group. **P < 0.01 versus the model group.
Abbreviation: IOD, integrated optical density.

