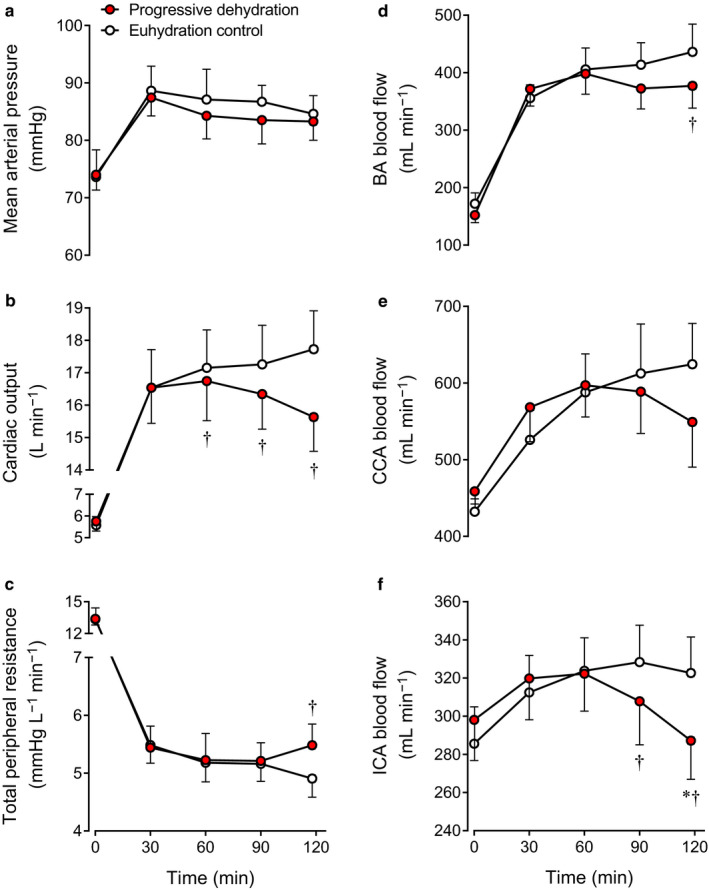
Figure 3.

Systemic (a–c) and peripheral (d–f) hemodynamics at rest and during prolonged exercise in the progressive dehydration and euhydration control trials. Data are means ± SEM for 8 subjects. *p < .05 versus 30 min; † p < .05 versus euhydration control
