
Figure 7.
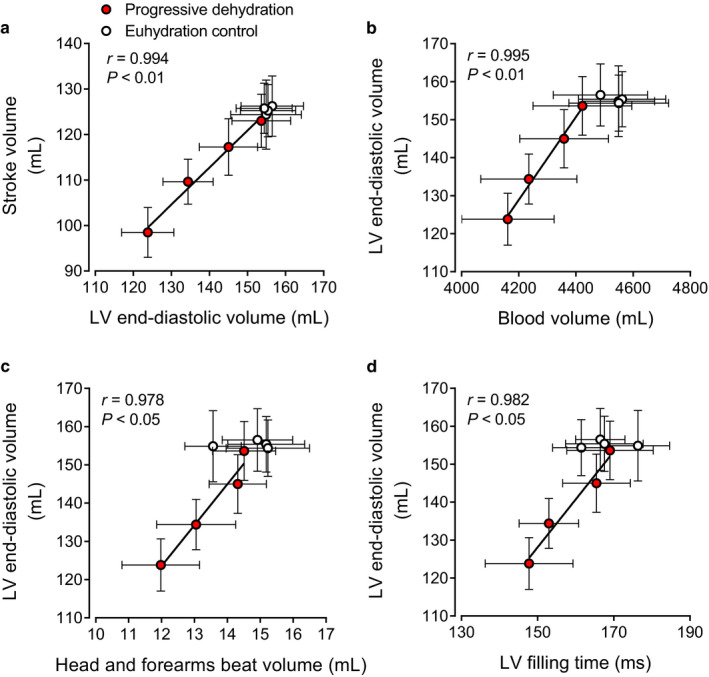
Relationships between stroke volume and LV end‐diastolic volume (a) and between LV end‐diastolic volume and blood volume (b), head and forearms beat volume (c), or LV filling time (d) during prolonged exercise in the progressive dehydration and euhydration control trials. Data are means ± SEM for seven (blood volume) or eight (the other parameters) subjects. Lines are regression lines