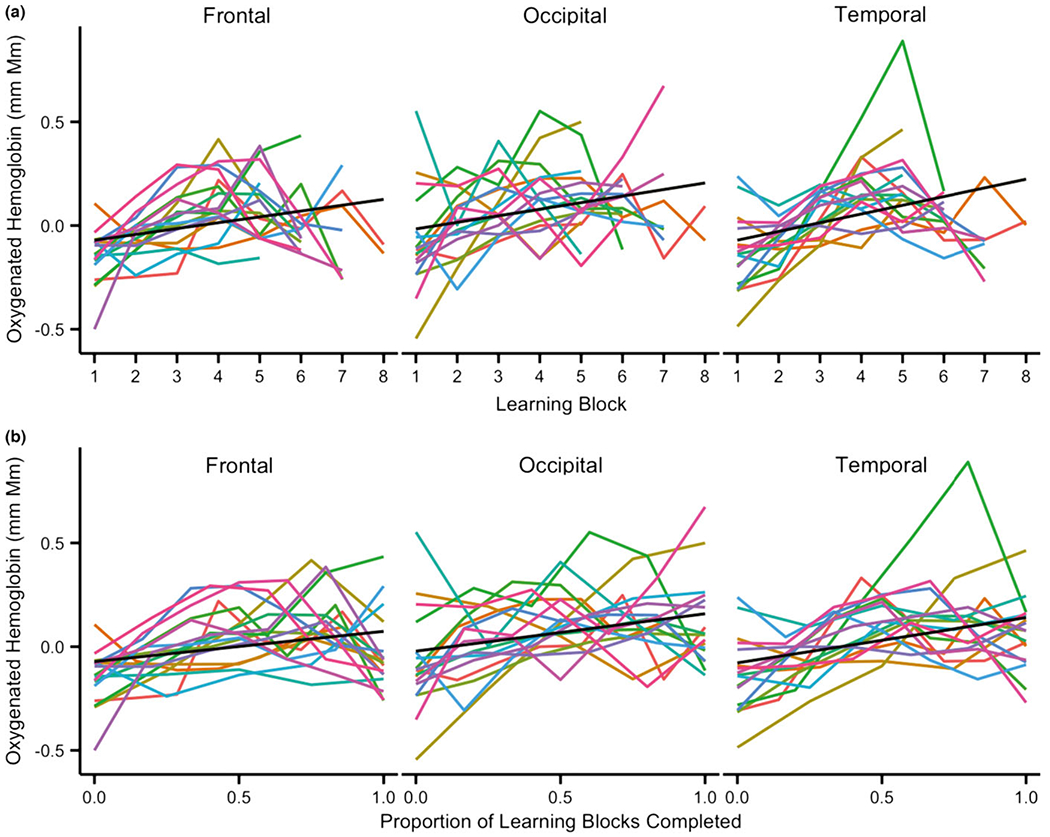
Figure 3.

Predicted data from linear mixed effect models for data plotted by (a) number of learning blocks and (b) proportion of learning blocks completed (i.e. a normalized learning time-course). Black line: Linear fit of the model; Colored lines: Individual data for each infant included in the analyses. Note: Excluding the infant in green with a sharp peak in the temporal channels did not qualitatively change these results.
