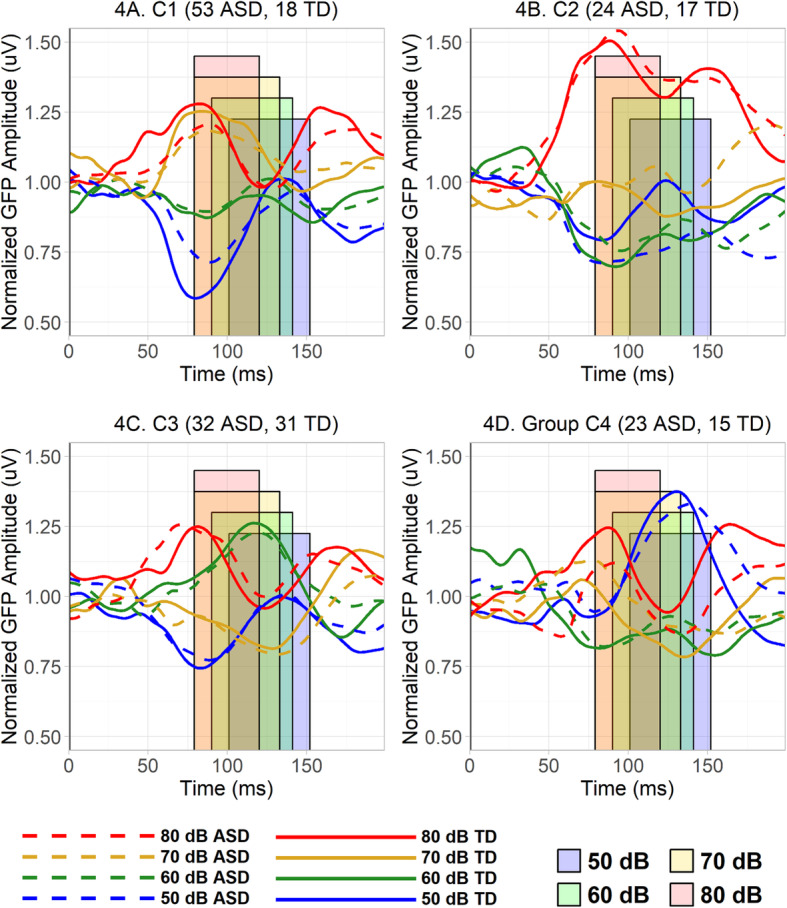
Fig. 4.

a–d Normalized GFP averaged, separately in each loudness condition and diagnostic group, across participants each group and cluster. The overlapping colored rectangles represent the different 85% fractional peak latency time windows from each of the different loudness conditions. Note that while normalized GFP patterns do differ across clusters, ASD and TD participants within each cluster appear similar. a Normalized GFP averaged, separately in each loudness condition and diagnostic group, across participants from C1. b Normalized GFP averaged across participants in each diagnostic group from C2. c Normalized GFP averaged across participants in each diagnostic group from C3. d Normalized GFP averaged across participants in each diagnostic group from C4
