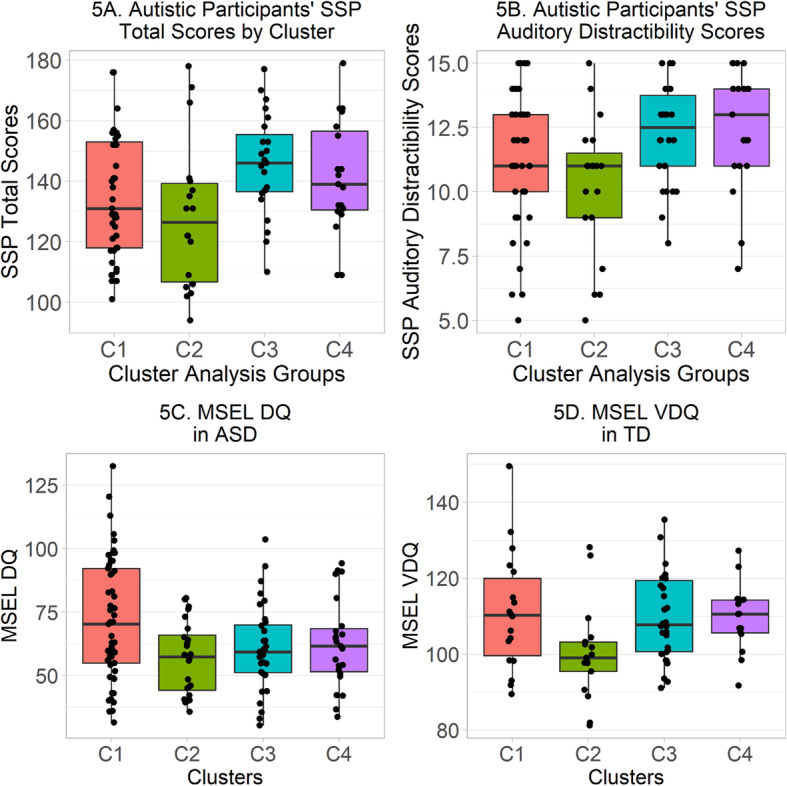
Fig. 5.

a–d a Total SSP scores in autistic participants from each cluster. Counting only those with complete SSP data, C1 contains 39 autistic participants, C2 contains 18 autistic participants, C3 contains 23 autistic participants, and C4 contains 19 autistic participants. Outer limits (hinges) of boxes correspond to first and third quartiles (25th and 75th percentiles) and whiskers extend either 1.5× the interquartile range outwards from the boxes, or the range of the data, whichever is smaller. b SSP Auditory Distractibility scores in autistic participants from each cluster. Counting only those with complete SSP Auditory Distractibility data, C1 contains 41 autistic participants, C2 contains 19 autistic participants, C3 contains 26 autistic participants, and C4 contains 19 autistic participants. c MSEL DQ in autistic participants from each cluster. d MSEL VDQ in typically developing participants from each cluster
