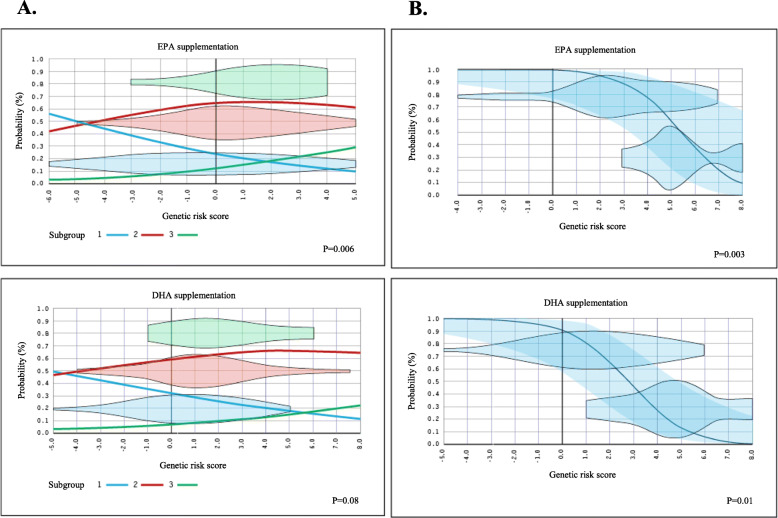
Fig. 1.
Predicted probability of classification into each subgroup of triglyceride responsiveness following EPA or DHA supplementation. The predicted probability of classification into each of the subgroups of triglyceride responsiveness (R/NR/AR) according to the genetic risk score is represented by curves. Predicted probabilities were assessed by ordinal (a) and binary (b) logistic regression, adjusted for age, sex, and body mass index. The observed density distribution of participants according to their genetic risk score is illustrated by horizontal violin plots, which are independent of the y-axis. a All the participants are included in the genetic risk model: (1) responders (R), (2) non-responders (NR), and (3) adverse responders (AR). b Only R (upper violin) and AR (lower violin) participants are included in the genetic risk model (NR participants are excluded). The 95% confidence intervals are highlighted in blue

