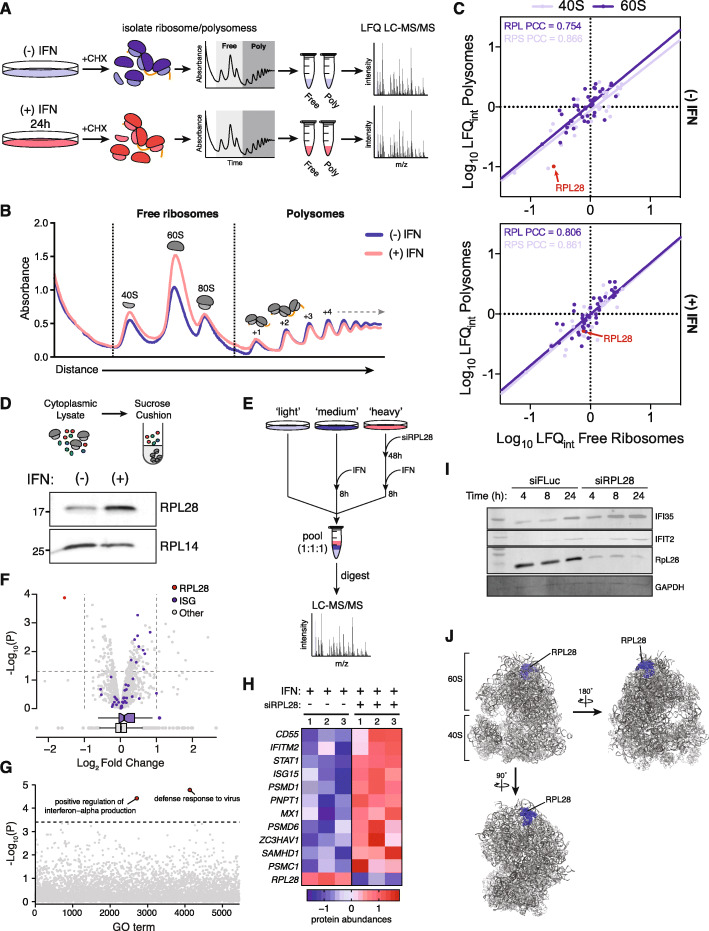
Fig. 6.
IFN stimulation induces changes in ribosome composition to regulate ISG synthesis. a Schematic overview of the sucrose gradient experiments to determine changes in composition of free (40S, 60S, and 80S) and actively translating ribosomes (polysomes). b Representative traces of sucrose density gradients from cells stimulated with IFN for 24 h or unstimulated cells. c Median protein abundance across three replicates from pooled free ribosome or polysome fractions by label-free quantification (LFQ) in IFN-stimulated or unstimulated cells. PCC, Pearson’s correlation coefficient. d Western blot of ribosomes isolated from IFN-stimulated or unstimulated cells by sucrose cushion. e Experimental workflow for shotgun proteomics analysis on RPL28-depleted cells after IFN stimulation. f Volcano plot showing differential protein abundance in cells stimulated with IFN for 8 h and treated with siRPL28, relative to controls. gp values from gene set enrichment analysis (GSEA) of 5453 GO terms in a comparison of siRPL28-treated and IFN-stimulated cells compared to untreated controls. Dotted line shows the statistical significance of ISGs by GSEA (Fig. S9E). Points in red represent GO terms more significantly enriched than ISGs. h Heatmap showing abundance of select well-studied ISGs in siRPL28-treated and IFN-stimulated cells compared to untreated controls. i Western blots of select ISGs in cells treated with siRPL28 or control siRNA after 4 h, 8 h, and 24 h of IFN stimulation. j Crystal structure of the human 80S ribosome (PDB: 4UG0), with RPL28 highlighted in blue

