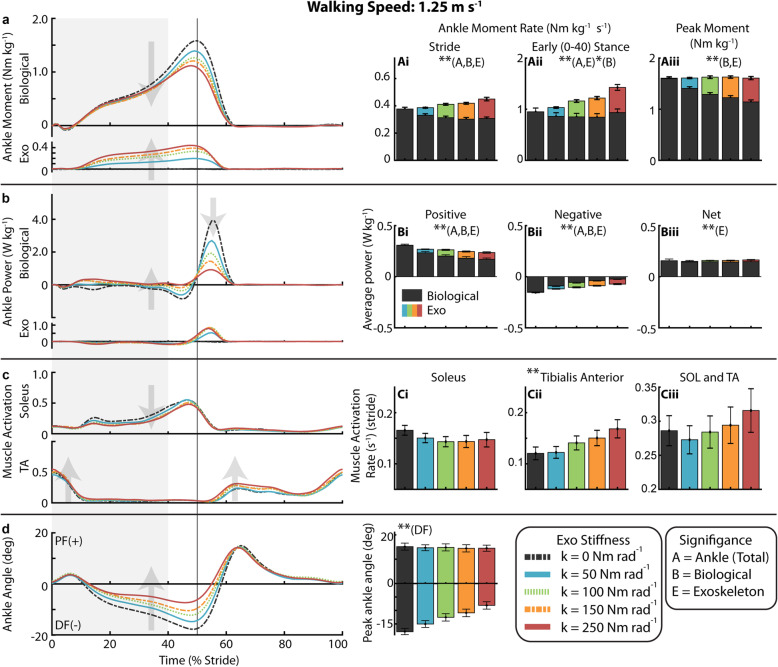
Fig. 3.
Ankle mechanics and muscle activity during walking at 1.25 m s− 1. (a) Mass normalized biological moment and exoskeleton torque for each stiffness averaged over participants. Shaded region is early stance (0-40%). Increasing exoskeleton stiffness resulted in increased exoskeleton torque and decreased biological moment. Total ankle moment increased at early stance, but peak moment remained nearly constant. Stacked bar charts represent the average biological (black-lower) and exoskeleton (colors-upper) contribution to total ankle moment rate for gait cycle phases. (b) Time series of 6-DOF biological ankle mechanical power and exoskeleton mechanical power for each stiffness. Ankle exoskeleton mechanical power remained consistent at high stiffnesses and biological ankle mechanical power decreased with increased stiffness. Stacked charts represent biological and exoskeleton contribution to total ankle joint mechanical power. Biological ankle net mechanical power was net positive for all conditions and exoskeleton net power was negligible. (c) Time-series of soleus and TA muscle activation. TA activation rate increased with stiffness. (d) Time series of ankle joint plantarflexion (PF) and dorsiflexion (DF) angle. The magnitude of peak ankle dorsiflexion angle decreased with increased ankle exoskeleton stiffness. [main effect: stiffness ** p < 0.0001 *p < 0.05; B = Biological, E = Exo, A = Total Ankle]

