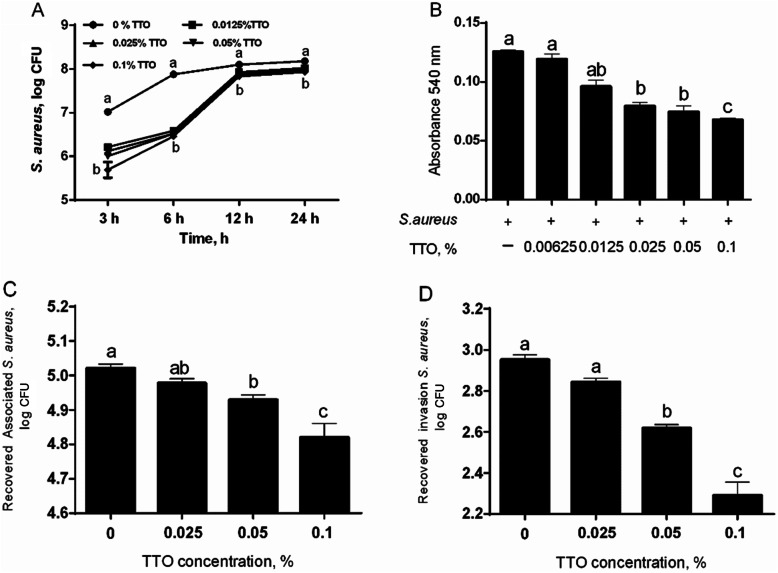
Fig. 3.
Evaluation of antibacterial effect of TTO. (a) The growth inhibition of S. aureus during 24 h treatment with 0, 0.0125%, 0.025%, 0.05%, or 0.1% TTO (n = 3). Log CFU bacteria were measured after 3 h, 6 h, 12 h, and 24 h. Means at the same time point with different letters (a, b) differ significantly for treatment effect. (b) Biofilm formation. The S. aureus cultures were incubated with 0 (control group), 0.00625%, 0.0125%, 0.025%, 0.05%, or 0.1% TTO (n = 6) and absorbance at 540 nm measured. (c) The association of BMECs. The BMEC were incubated in DMEM/F12 medium containing S. aureus and 0 (control group), 0.025%, 0.05%, or 0.1% TTO (n = 3). (d) The invasion of BMECs. The BMEC were incubated in DMEM/F12 medium containing S. aureus and 0 (control group), 0.025%, 0.05%, or 0.1% TTO (n = 3). Data are presented as the means ± SEM. Means at the different concentration of TTO with different letters (a-c) differ significantly for treatment effect

